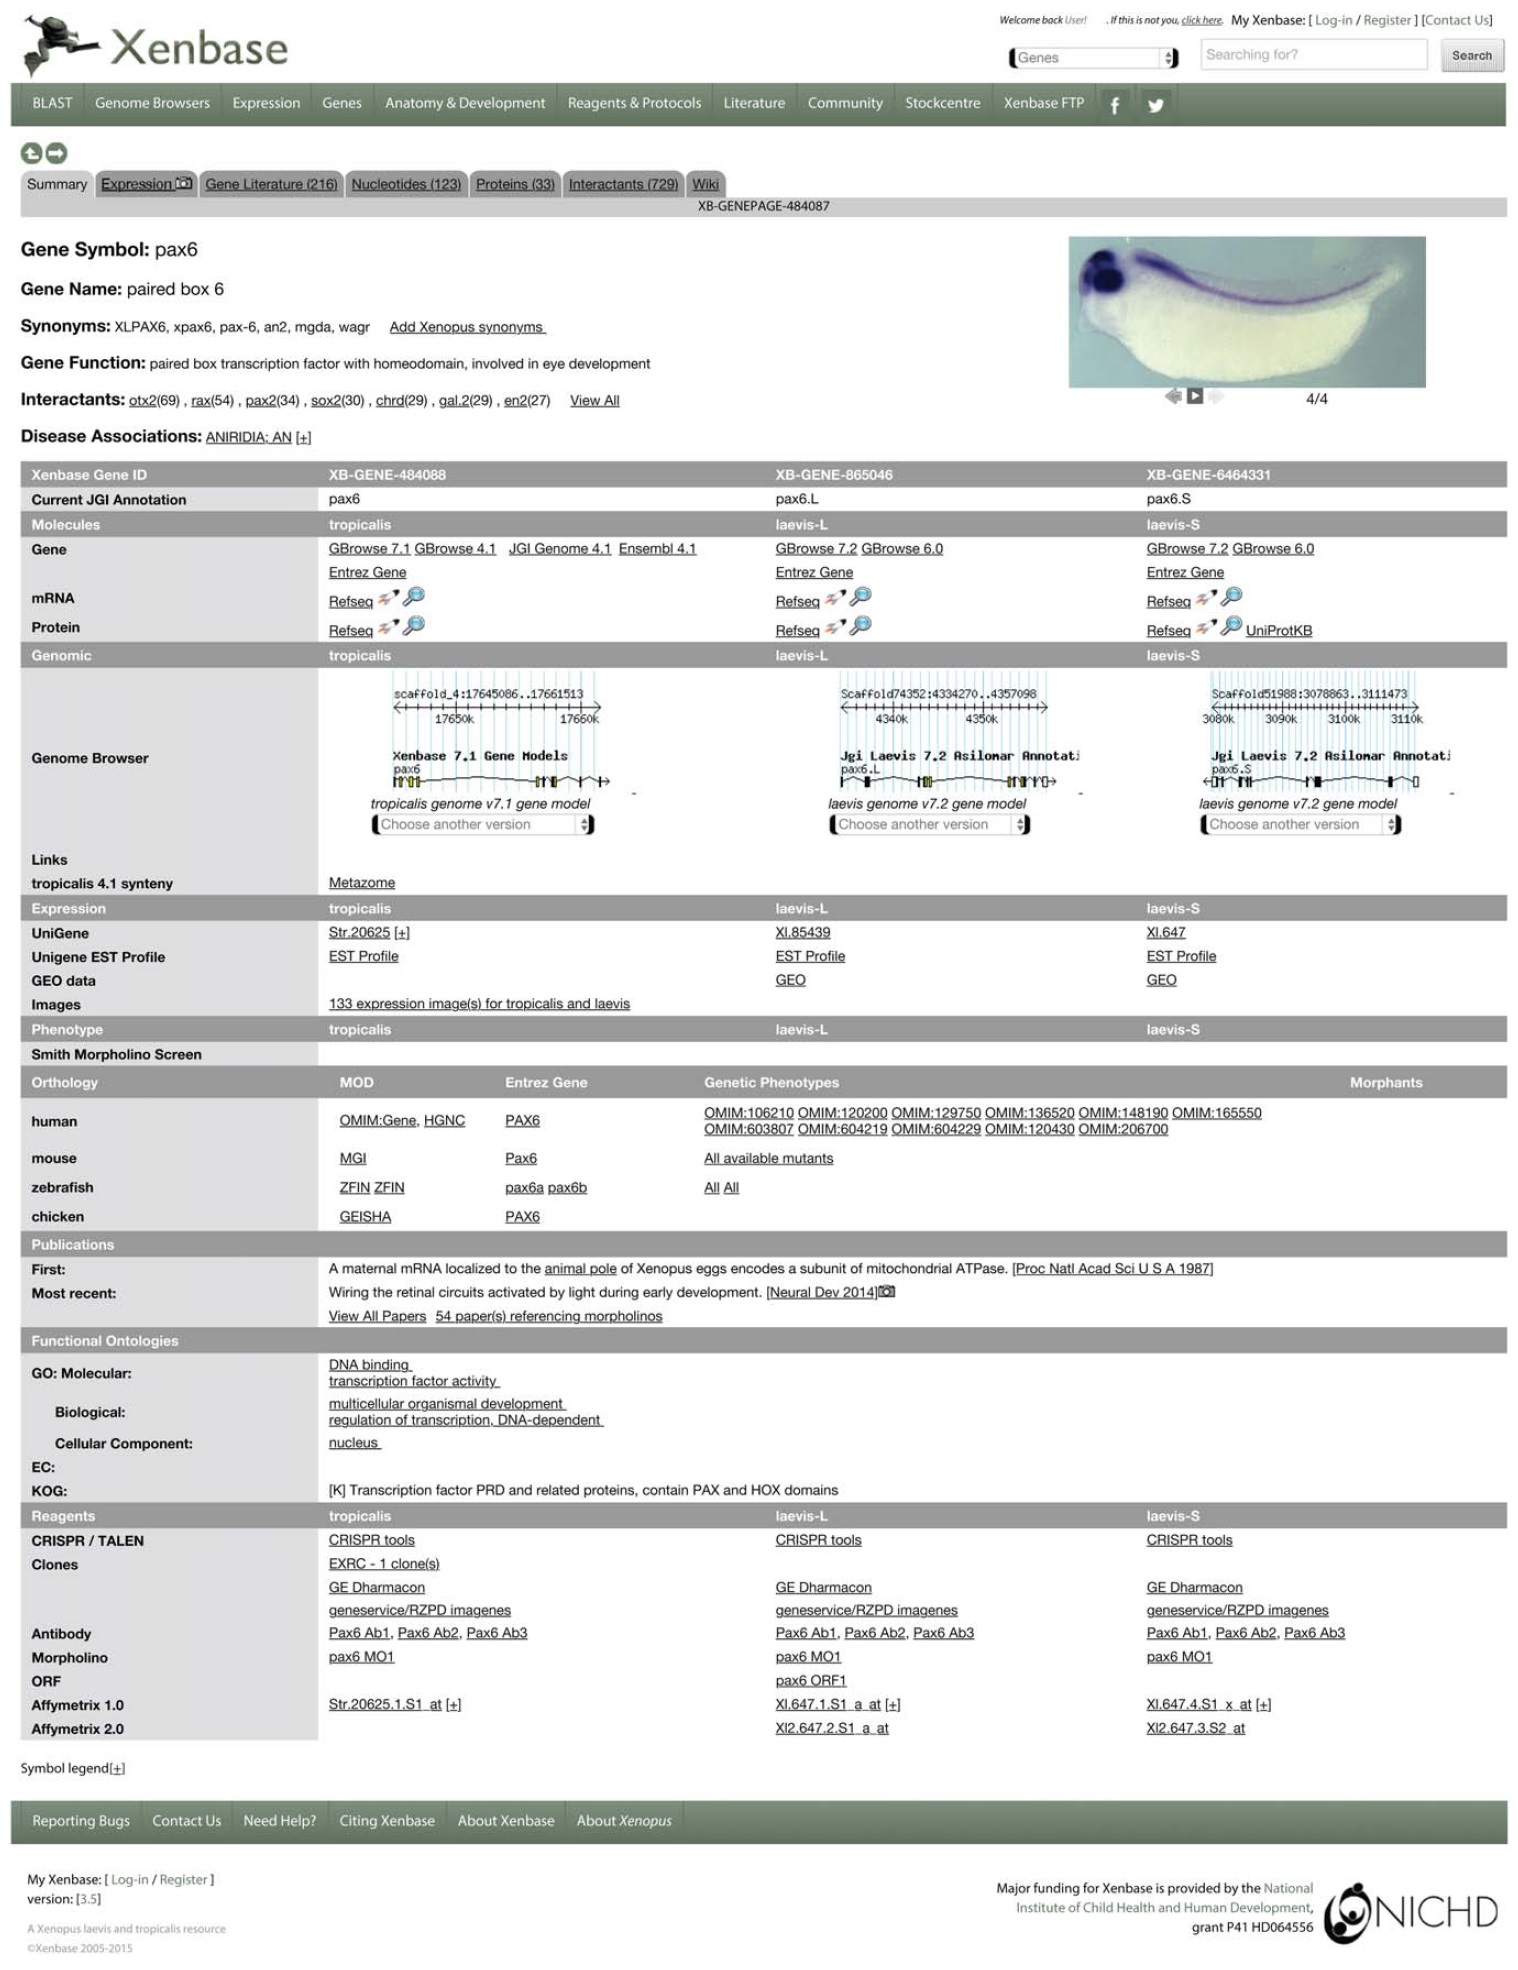
FIG. 2. An example of a Xenbase Gene Page. In this example, data for the pax6 gene is displayed. Under the top navigation bar, a set of âtabsâ are visible, each of which will load specialized content when selected. Within the body of the Summary tab (the default), information is organized into rows containing the same type of data, and columns that contain data from the same species or subgenome. Most tabs indicate whether they contain content with either an icon or number, to avoid nonproductive selection of empty tabs.
Image published in: James-Zorn C et al. (2015)
Copyright © 2015. Image reproduced with permission of the Publisher, John Wiley & Sons.
Permanent Image Page
Printer Friendly View
XB-IMG-145536