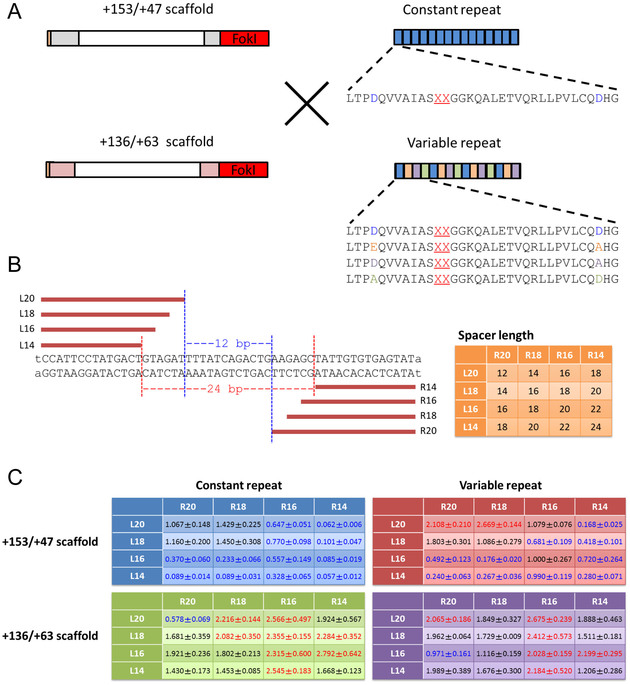
Figure 2: Comprehensive analysis of four types of TALEN framework using the SSA assay. (A) Schematic drawing of scaffold and module swapping analysis. Underlined red letters indicate RVDs. Four types of non-RVD variant are indicated in blue, orange, purple, and green letters, respectively. Repeating pattern of VRs is represented using blue, orange, purple, and green boxes. (B) Schematic design of TALENs used in this assay. Seven TALENs with different numbers of TALE repeats (red bars) were constructed for both left (L14–L20) and right (R14–R20) target sequences. Minimum spacer region is indicated by blue lines and letters. Maximum spacer region is illustrated by red lines and letters. Spacer lengths for all the combinations of left and right TALENs are represented in the table. (C) Relative activities (fold to positive control ZFN9) of all the TALENs are shown in the tables. Red, black, and blue letters indicate high (>2), intermediate (1–2), and low (<1) activities, respectively. Data are expressed as means ± SEM (n = 3).
Image published in: Sakuma T et al. (2013)
Copyright © 2013, Macmillan Publishers Limited. Creative Commons Attribution-NonCommercial-ShareAlike license
Permanent Image Page
Printer Friendly View
XB-IMG-147163