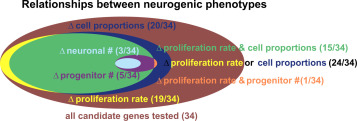
Fig. 9. Candidate gene sets defined by neurogenesis phenotypes. Categories of neurogenesis phenotypes from morpholinos are shown as colored ellipses where the area of each ellipse is proportional to the number of genes in that category. Of the 34 candidate genes (red) tested with morpholino treatment, 24 significantly altered the proportions of cell types (blue circle, Pearson's Chi-square) and 19 significantly altered the proliferation rate (yellow, MannâWhitney U test). The morpholinos against 15 candidate genes altered both the cell types generated and the proliferation rate. The overlap between these two categories is shown in green. Among these 15 genes, 5 generated significant differences in the proportions of NPCs (purple, MannâWhitney U test) and of those, 3 also had significant differences in the number of neurons that were generated (light blue, MannâWhitney U test). One of the 5 (purple) changed both proliferation rate and NPC number (peach).
Image published in: Bestman JE et al. (2015)
Image reproduced on Xenbase with permission of the publisher and the copyright holder. Creative Commons Attribution-NonCommercial-NoDerivatives license
Permanent Image Page
Printer Friendly View
XB-IMG-148421