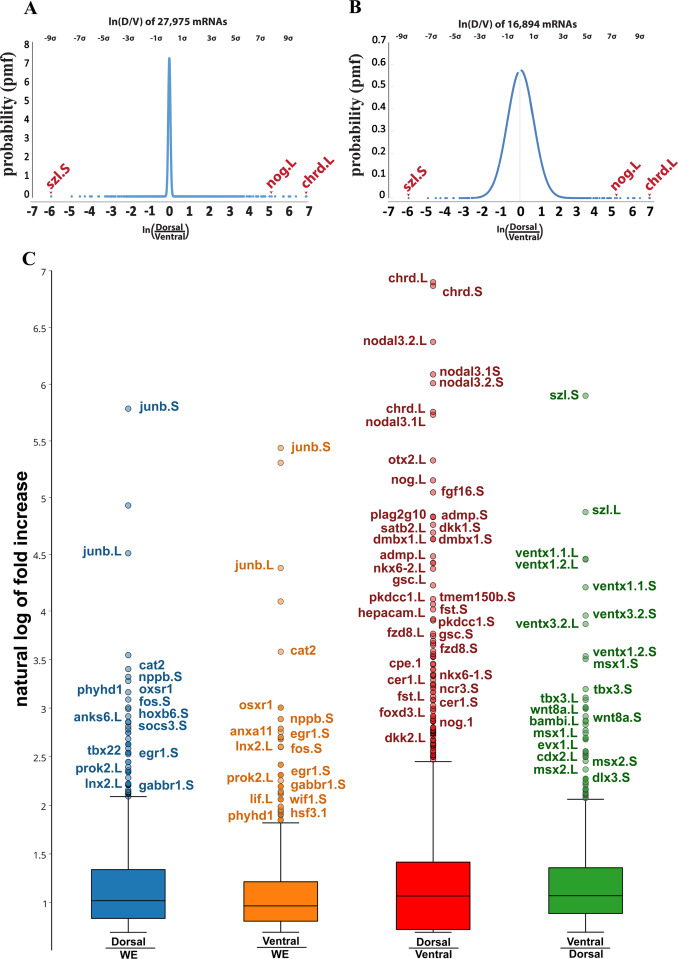
Fig. 2. Distribution of transcripts sequenced from dorsal and ventral lips. (A) Curve showing normal distribution of fold change of dorsal transcripts. The curve was created using 27,594 mRNAs obtained from the first experiment after selecting for abundance of expression; the ordinate indicates the probability that a gene is located in the curve by chance (probability mass function). Genes were organized by the dorsal/ventral natural logarithm, providing dorsal genes with positive values, while assigning negative numbers to ventral genes. (B) A normal Gaussian curve was obtained by artificially removing about 11,000 transcripts expressed at similar levels in both dorsal and ventral lips. The graph indicates that the data obtained was evenly distributed throughout both dorsal and ventral lips and defined the standard deviation. The most dorsal gene was Chordin, 9 standard deviations above the mean, while the most ventrally expressed gene was Sizzled, 8 standard deviations above the mean. (C) Box and whisker plots reveal transcripts upregulated upon bisection of dorsal (Dorsal/WE) or ventral (Ventral/WE) lips compared to uncut wild type whole embryos (WE), and dorsal and ventral transcriptomes (Dorsal/Ventral and Ventral/Dorsal). Only some of the outliers above the whisker are annotated, with Short on the right and Long subgenome genes on the left. Chordin is referred to by its abbreviation chrd in this Figure and throughout the Supplementary Tables and Xnr3 in the main text is referred to as nodal 3 here. Note that cutting the embryo triggers the expression of injury response genes in both fragments.
Image published in: Ding Y et al. (2017)
Copyright © 2017. Image reproduced with permission of the Publisher, Elsevier B. V.
Permanent Image Page
Printer Friendly View
XB-IMG-150816