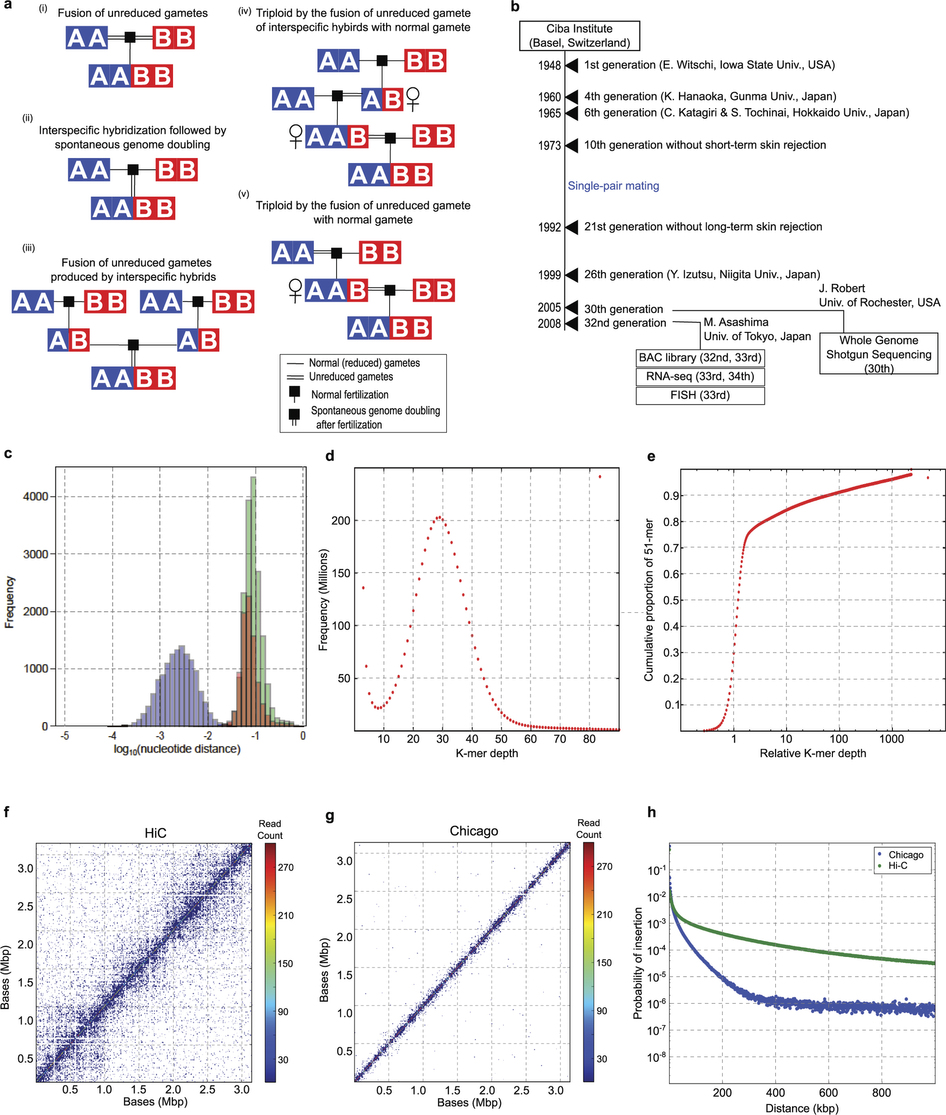
a–e, Scenarios for allotetraploid formation from distinct ancestral diploid species A and B. Horizontal single lines indicate normal gametes, horizontal double lines indicate unreduced gametes; black square represents fertilization; vertical double lines indicate spontaneous (somatic) genome doubling. a, (i) Fusion of unreduced gametes from species A and B. (ii) Interspecific hybridization followed by spontaneous doubling. (iii) Fusion of unreduced gametes produced by interspecific hybrids. (iv) Interspecific hybrids produce unreduced gametes, which fuse with normal gametes from species A. The resulting triploid again produces unreduced gametes, which fuse with normal gametes from species B. (v) Unreduced gamete from species A fuses with normal gamete from species B. The resulting AAB triploid produces unreduced gametes that are fertilized by normal gametes species B. See Supplementary Note 1.1 for a more detailed discussion. b, History of the J strain. See Supplementary Note 2.1 for details. The years of events and generation numbers (such as frog transfer to another institute, establishment of homozygosity, construction of materials) are indicated in the scheme. Generation numbers are estimates due to loss of old breeding records. c, The nucleotide distance of orthologues (green), homoeologues (red) and alleles (blue) is discussed in Supplementary Note 8.7. The distances are shown on a log scale to differentiate between the distributions. d, Frequency histogram showing the number of 51-mers with specified count in the shotgun dataset. The prominent peak implies that each genomic locus is sampled 29× in 51-mers. Note the absence of a feature at twice this depth, indicating that homoeologous features with high identity are rare. e, Cumulative proportion of 51-mers as a function of relative depth (that is, depth/29). Relative depth provides an estimate of genomic copy number. The rapid rise at relative depth 1 implies that 70–75% of the X. laevis genome is a single copy with respect to 51-mers. The remainder of the genome is primarily concentrated in repetitive sequences with copy number > 100. Note logarithmic scale. f, The contact map of 85,260 TCC read pairs for JGIv72.000090484.chr4S. Read pairs were binned at 10-kb intervals. For each read pair, the forward and reverse reads map with a map quality score of at least 20. g, The contact map of 85,260 Chicago read pairs for JGIv72.000090484.chr4S, a 3.1-Mb scaffold in the XENLA_JGI_v72 assembly. h, The insert distribution of TCC and Chicago read pairs that map to the same scaffold of XENLA_JGI_v72 with a map quality score of at least 20. The x axis is the read pair separation distance. The y axis is the counts for that bin divided by the total number of reads. The bins are 1 kb.
Image published in: Session AM et al. (2016)
Image downloaded from an Open Access article in PubMed Central. Image reproduced on Xenbase with permission of the publisher and the copyright holder.
Permanent Image Page
Printer Friendly View
XB-IMG-153331