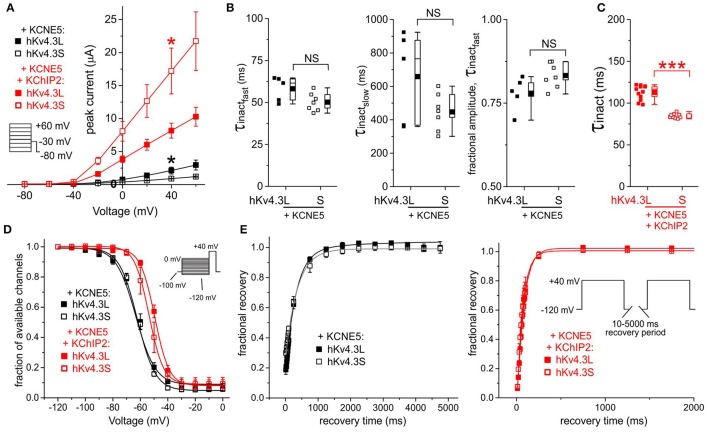
Figure 7. KCNE5 differentially affects Kv4.3L and Kv4.3S function. (A) Mean ± SEM peak current/voltage relationship for current traces recorded from Xenopus oocytes 36–48 h after injection of cRNA encoding Kv4.3L or Kv4.3S (1 ng) with KCNE5 (1–5 ng) with/without KChIP2b (5 ng; n = 6–12). *P < 0.05 between Kv4.3L and Kv4.3S with similar β subunits. Inset: Voltage clamp protocol. (B) Box plots showing individual and mean ± SEM values for τ of fast and slow components, and relative amplitude, of fast inactivation (double exponential fit) of Kv4.3L-KCNE5 vs. Kv4.3S-KCNE5 currents recorded as in (A); n = 5–7. NS, P > 0.05. (C) Box plot showing individual and mean ± SEM values for τ of inactivation (single exponential fit) for Kv4.3L vs. Kv4.3S co-expressed with KCNE5 and KChIP2; n = 9–12. ***P < 5 × 10⁻⁸. (D) Mean ± SEM fraction of available channels/voltage relationship for Kv4.3L-KCNE5 vs. Kv4.3S-KCNE5 channels with (n = 5–12) or without (n = 5–9) KChIP2; voltage protocol inset. (E) Mean ± SEM fractional recovery from inactivation/recovery time for Kv4.3L-KCNE5 vs. Kv4.3S-KCNE5 channels with (n = 7–8) or without (n = 5–6) KChIP2; voltage protocol inset.
Image published in: Abbott GW (2017)
Copyright © 2017 Abbott. Creative Commons Attribution license
Permanent Image Page
Printer Friendly View
XB-IMG-155661