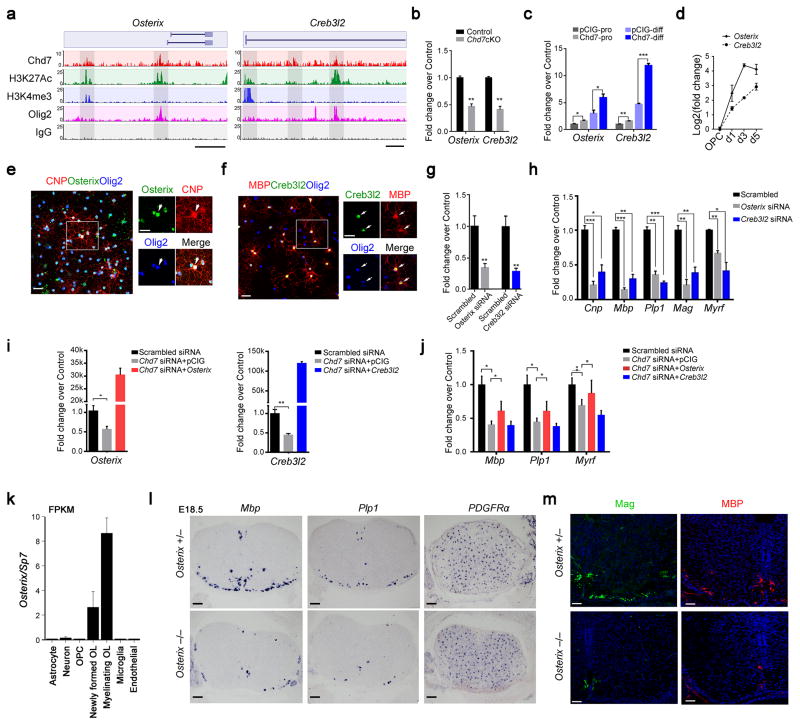
Figure 7. Osterix and Creb3l2 are direct Chd7 transcriptional targets and required for proper OL differentiation(a) ChIP-seq tracks for Chd7, H3K27Ac, Olig2, H3K4me3 and IgG at Osterix (left) and Creb3l2 (right) loci. Genome scale bars: 5 kb.(b) qRT-PCR analyses of Osterix and Creb3l2 in P8 control and Chd7cKO spinal cords (The data are presented as mean ± s.e.m. n = 3 controls and 3 mutant tissues; for Osterix ** p = 0.005, t = 5.64; for Creb3l2 ** p = 0.0019, t = 7.26; Two-tailed unpaired Student’s t test).(c) qRT-PCR analyses of Osterix and Creb3l2 in control and Chd7-overexpressing Oli-Neu cells under proliferation (pro) or differentiation (diff) conditions spinal cords (The data are presented as mean ± s.e.m. n = 3 biological replicates; for Osterix under proliferation condition, * p = 0.024, t = 3.551; for Osterix under differentiation condition, * p = 0.031, t = 3.269; for Creb3l2 under proliferation condition, * * p = 0.005, t = 5.565; for Creb3l2 under differentiation condition, *** p < 0.0001, t = 17.158; Two-tailed unpaired Student’s t test).(d) qRT-PCR analyses of Osterix and Creb3l2 expression during OL differentiation (The data are presented as mean ± s.e.m. n = 3 biological replicates).(e,f) Immunolabeling of Osterix or Creb3l2, CNP or MBP and Olig2 in primary mouse OLs. Scale bars, 50 μm. Boxed area (scale bar: 25 μm) was shown at a high magnification at right panels. Arrows indicate the co-labeling cells.(g) qPCR validation of knockdown efficiency of Osterix and Creb3l2 in primary rat OLs (The data are presented as mean ± s.e.m. For Osterix, n = 3 independent experiments, ** p = 0.0067, t = 5.17; for Creb3l2, n = 3 independent experiments, ** p = 0.0022, t = 6.97; Two-tailed unpaired Student’s t test).(h) qRT-PCR analyses of OL differentiation-associated genes following treatments with scrambled, Osterix or Creb3l2 siRNAs (The data are presented as mean ± s.e.m. n = 3 independent experiments; for Osterix siRNA vs scrambled siRNA, *** pCnp = 0.0008, tCnp = 9.013, *** pMbp = 0.00081, tMbp = 16.48, ** pPlp1 = 0.0011, tPlp = 8.49, ** pMag = 0.002, tMag = 7.43, ** pMyrf = 0.0014, tMag = 7.91; for Creb3l2 siRNA vs scrambled siRNA, * pCnp = 0.01, tCnp = 4.60, ** pMbp = 0.001, tMbp = 8.73, *** pPlp1 = 0.0002, tPlp = 12.97, ** pMag = 0.005, tMag = 5.65, * pMyrf = 0.014, tMag = 4.11; Two-tailed unpaired Student’s t test).(i) qRT–PCR analysis of Osterix (left) and Creb3l2 (right) expression in OPCs transfected with siRNAs against Chd7 with control vector or vectors overexpressing Osterix and Creb3l2, respectively (The data are presented as mean ± s.e.m. For Osterix, n = 4 independent experiments, * p = 0.013, t = 3.468; for Creb3l2, n = 5 independent experiments, ** p = 0.001, t = 5.07; Two-tailed unpaired Student’s t test).(j) qRT–PCR analysis of differentiation-associated genes (Mbp, Plp1, and Myrf) in OPCs transfected with siRNAs against Chd7 with control vector or vectors overexpressing Osterix and Creb3l2, respectively (The data are presented as mean ± s.e.m. n = 3 (scrambled siRNA), 3 (Chd7 siRNA + pCIG), 4 (Chd7 siRNA + Osterix), 4 (Chd7 siRNA + Creb3l2); n, numbers of biological replicates. For Mbp, ANOVO F (3, 11) = 10.77; multiple comparisons with t-test, * pscrambled siRNA vs Chd7 siRNA = 0.012, tscrambled siRNA vs Chd7 siRNA = 4.30, * ppCIG vs Osterix = 0.036, tscrambled siRNA vs Chd7 siRNA = 2.83. For Plp1, ANOVO F (3, 11) = 10.99; multiple comparisons with t-test, * pscrambled siRNA vs Chd7 siRNA = 0.022, tscrambled siRNA vs Chd7 siRNA = 3.63, * ppCIG vs Osterix = 0.045, tscrambled siRNA vs Chd7 siRNA = 2.65. For Myrf, ANOVO F (3, 11) = 7.42; multiple comparisons with t-test, * pscrambled siRNA vs Chd7 siRNA = 0.047, tscrambled siRNA vs Chd7 siRNA = 2.84, * ppCIG vs Osterix = 0.049, tscrambled siRNA vs Chd7 siRNA = 2.62).k) Graph depicts RNA abundance represented as FPKM in indicated neural cell types.l) RNA in situ hybridization for Mbp, Plp1 and PDGFRα on transverse spinal cord sections from Osterix +/− and Osterix −/− mice at E18.5. Scale bar, 100 μm.m) Immunolabeling for Mag and MBP on transverse spinal cord sections from Osterix+/− and Osterix −/− mice at E18.5. Scale bars, 50 μm.
Image published in: He D et al. (2016)
Image downloaded from an Open Access article in PubMed Central. Image reproduced on Xenbase with permission of the publisher and the copyright holder.
Permanent Image Page
Printer Friendly View
XB-IMG-169576