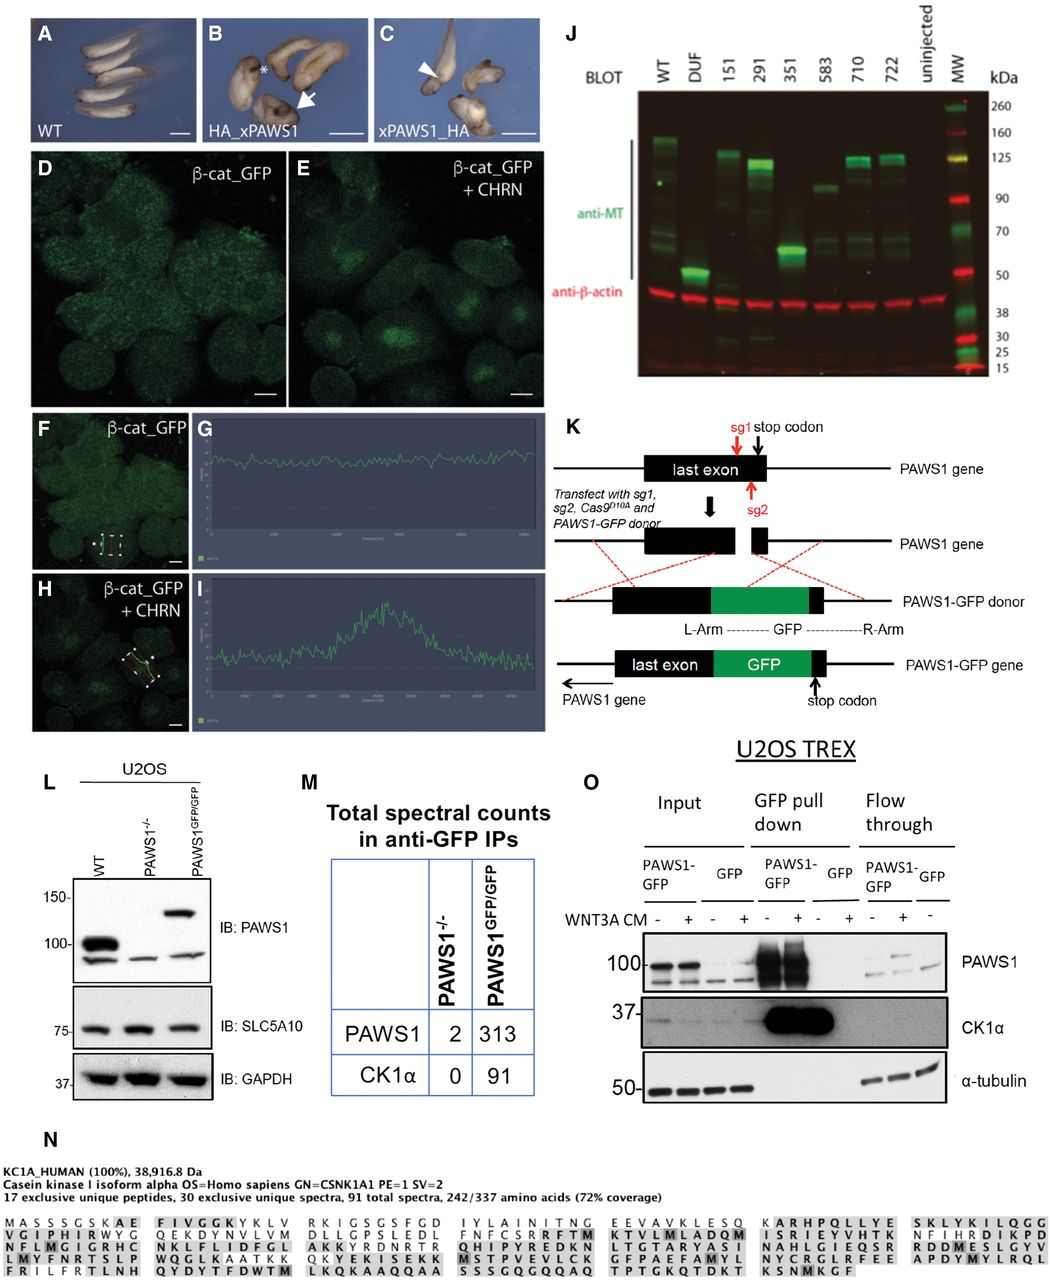
Figure EV1. Manipulation of PAWS1 in Xenopus embryos and human U2OS cells AâC Ectopic axis induction in Xenopus embryos following xPAWS1 mRNA injection. Xenopus embryos were injected at the oneâcell stage with 500 pg of either HA_xPAWS1 (B) or xPAWS_HA mRNA(C). A variety of dorsalised phenotypes were observed including enlarged cement glands (asterisk), partial (arrowhead) and complete secondary axis (arrow). Scale bars are 2 mm. DâI Dissociated animal caps injected with 50 pg of βâcatenin_GFP mRNA were imaged over 3 h following treatment with the GSK3β inhibitor CHIR99021. Maximum intensity projection of βâcatenin_GFPâinjected cells before (D) and 3 h (E) after CHIR99021 treatment, demonstrating stabilisation and nuclear localisation of βâcatenin_GFP in the absence of xPAWS1. Single zâsection of a βâcatenin_GFP expressing cell and corresponding fluorescence intensity profile across the nucleus before (F and G) and following 3 h of CHIR99021 treatment (H and I). Cells were imaged using a Zeiss LSM710 microscope, and intensity measurements from a single zâsection were taken using Zen Black software. Scale bars are 20 μm. J. Expression level of Mycâtagged(MT)xPAWS1 and MTxPAWS1 mutants at stage 10. Extracts from embryos injected with 250 pg of MTxPAWS1 and MTxPAWS1 mutants were immunoblotted with antibodies against Mycâtag (green) and αâtubulin (red). The image was captured with a LiâCor Odyssey scanner using Image Studio software (LiâCor). K. Schematic illustration of the strategy employed to generate PAWS1âGFP knockâins in U2OS cells. A pair of guide RNAs which recognise a genomic sequence upstream of the stop codon of PAWS1 gene was used in combination with a donor vector which inserts GFP in frame with the câterminus of PAWS1. L. Cell extracts from PAWS1GFP/GFP cells compared with the PAWS1â/â, confirmed that the gene in the reverse DNA strand of PAWS1, SLC5A10 is not disturbed. M. Mass fingerprinting analysis of PAWS1âGFP interactors from PAWS1GFP/GFPâknockâin U2OS cells compared with PAWS1â/â U2OS cells (from Fig 5A) identified CK1α as a major interactor. The table shows total spectral counts for PAWS1 and CK1α tryptic peptides identified in antiâGFP IPs. N. The highlighted tryptic peptides identified by mass spectrometry on CK1α indicate the overall protein coverage. The included image was obtained using Scaffold V4.3 analysis of the LCâMS/MS data. O. Stable U2OS FlpâIn Trex cells were subjected to 20 ng/ml doxycycline for inducing PAWS1âGFP expression or GFP expression alone for 24 h. Wnt3A or control medium was added to the cells for 6 h before lysis. 20 mg of cell extract was subjected to GFPâtrap IP. Input (20 μg protein), 5% of the pull down and flowâthrough extract (20 μg protein) were subjected to SDSâPAGE followed by Western blot analysis with the indicated antibodies.
Image published in: Bozatzi P et al. (2018)
© 2018 The Authors. Creative Commons Attribution license
Permanent Image Page
Printer Friendly View
XB-IMG-172078