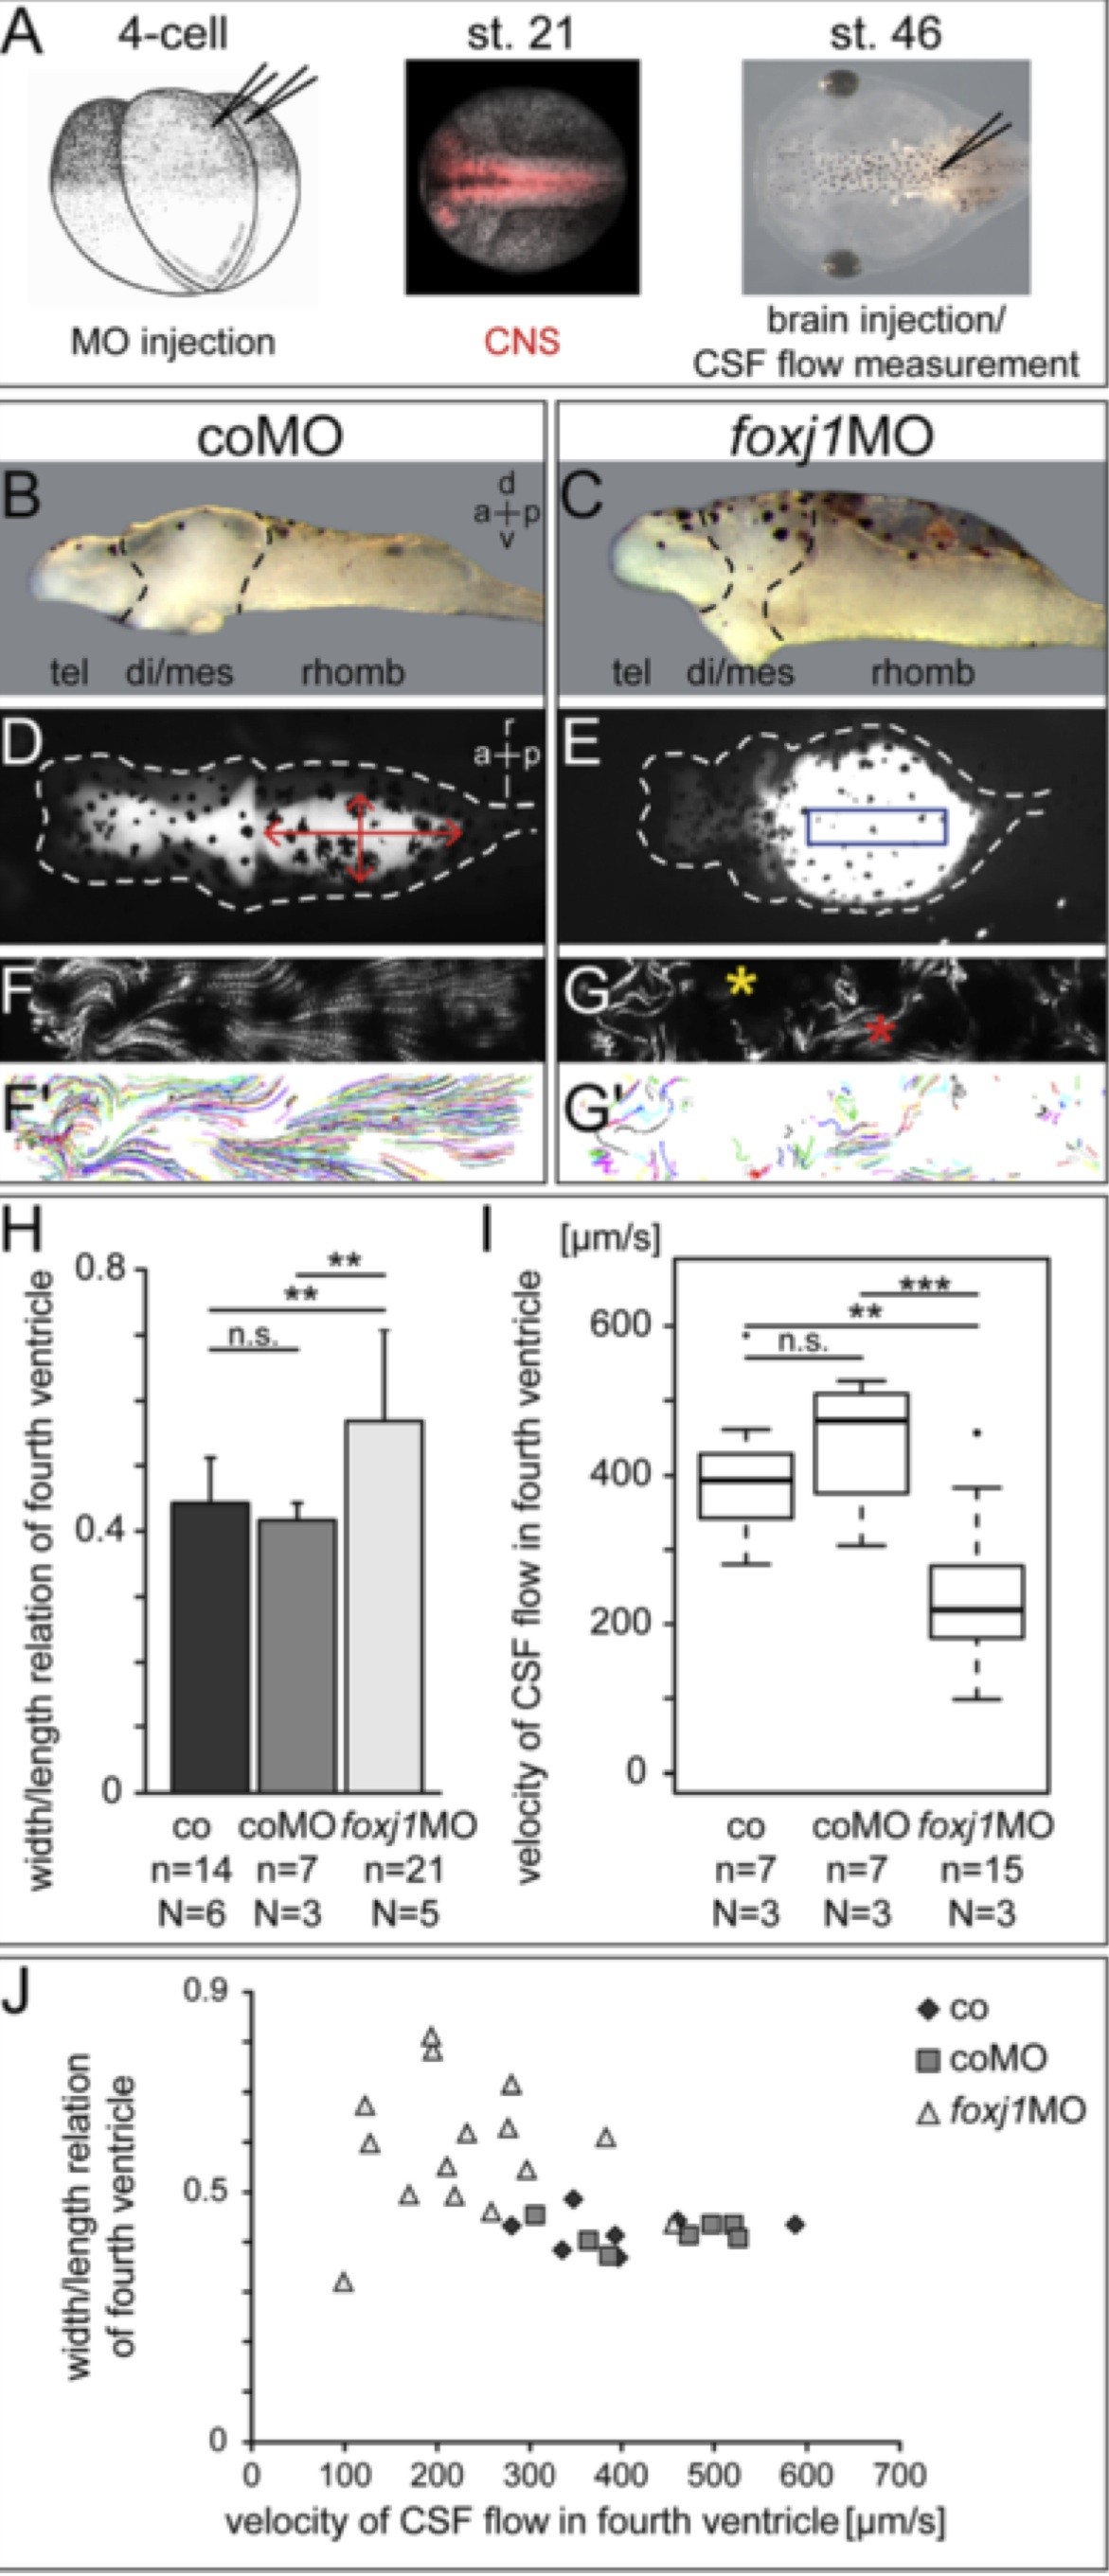
Figure 5. Loss of function of foxj1 in the central nervous system induces hydrocephalus. (A) Timeline of experimental process. (B, D, F, F?) Control morpholino (coMO) -injected specimen. (C, E, G, G?) foxj1 morpholino (foxj1MO) -injected specimen. (B, C) Brain explants of stage 46 tadpoles, side view. (D, E) Dorsal (d) view of tadpole heads at stage 46; ventricular system visualized by injection of a fluorescent dye. Note the obstruction of the ventricular system and the hydrocephalic hindbrain ventricle in foxj1MO -injected embryos in (E). (F, G) Z-projection of video-tracked fluorescent beads. (F?, G?) Display of statistically analyzed bead trajectories. (H) Statistical analysis of fourth ventricle width to length relation, measured as indicated in (D). 0 = linear ventricle, 1 = perfect circle; error bars represent SD. (I) Statistical analysis of CSF flow velocity in the fourth ventricle. Region of interest chosen for flow measurement as indicated by blue box in (E). (J) Correlation of statistical analyses in (H) and (I). a = anterior; CNS = central nervous system; co = control; CSF = cerebrospinal fluid; di = diencephalon; l = left; mes = mesencephalon; n = number of specimens; N = number of experiments; p = posterior; r = right, rhomb = rhombencephalon; tel = telencephalon; v = ventral.
Image published in: Hagenlocher C et al. (2013)
Copyright © 2013 Hagenlocher et al. Creative Commons Attribution license
Permanent Image Page
Printer Friendly View
XB-IMG-83756