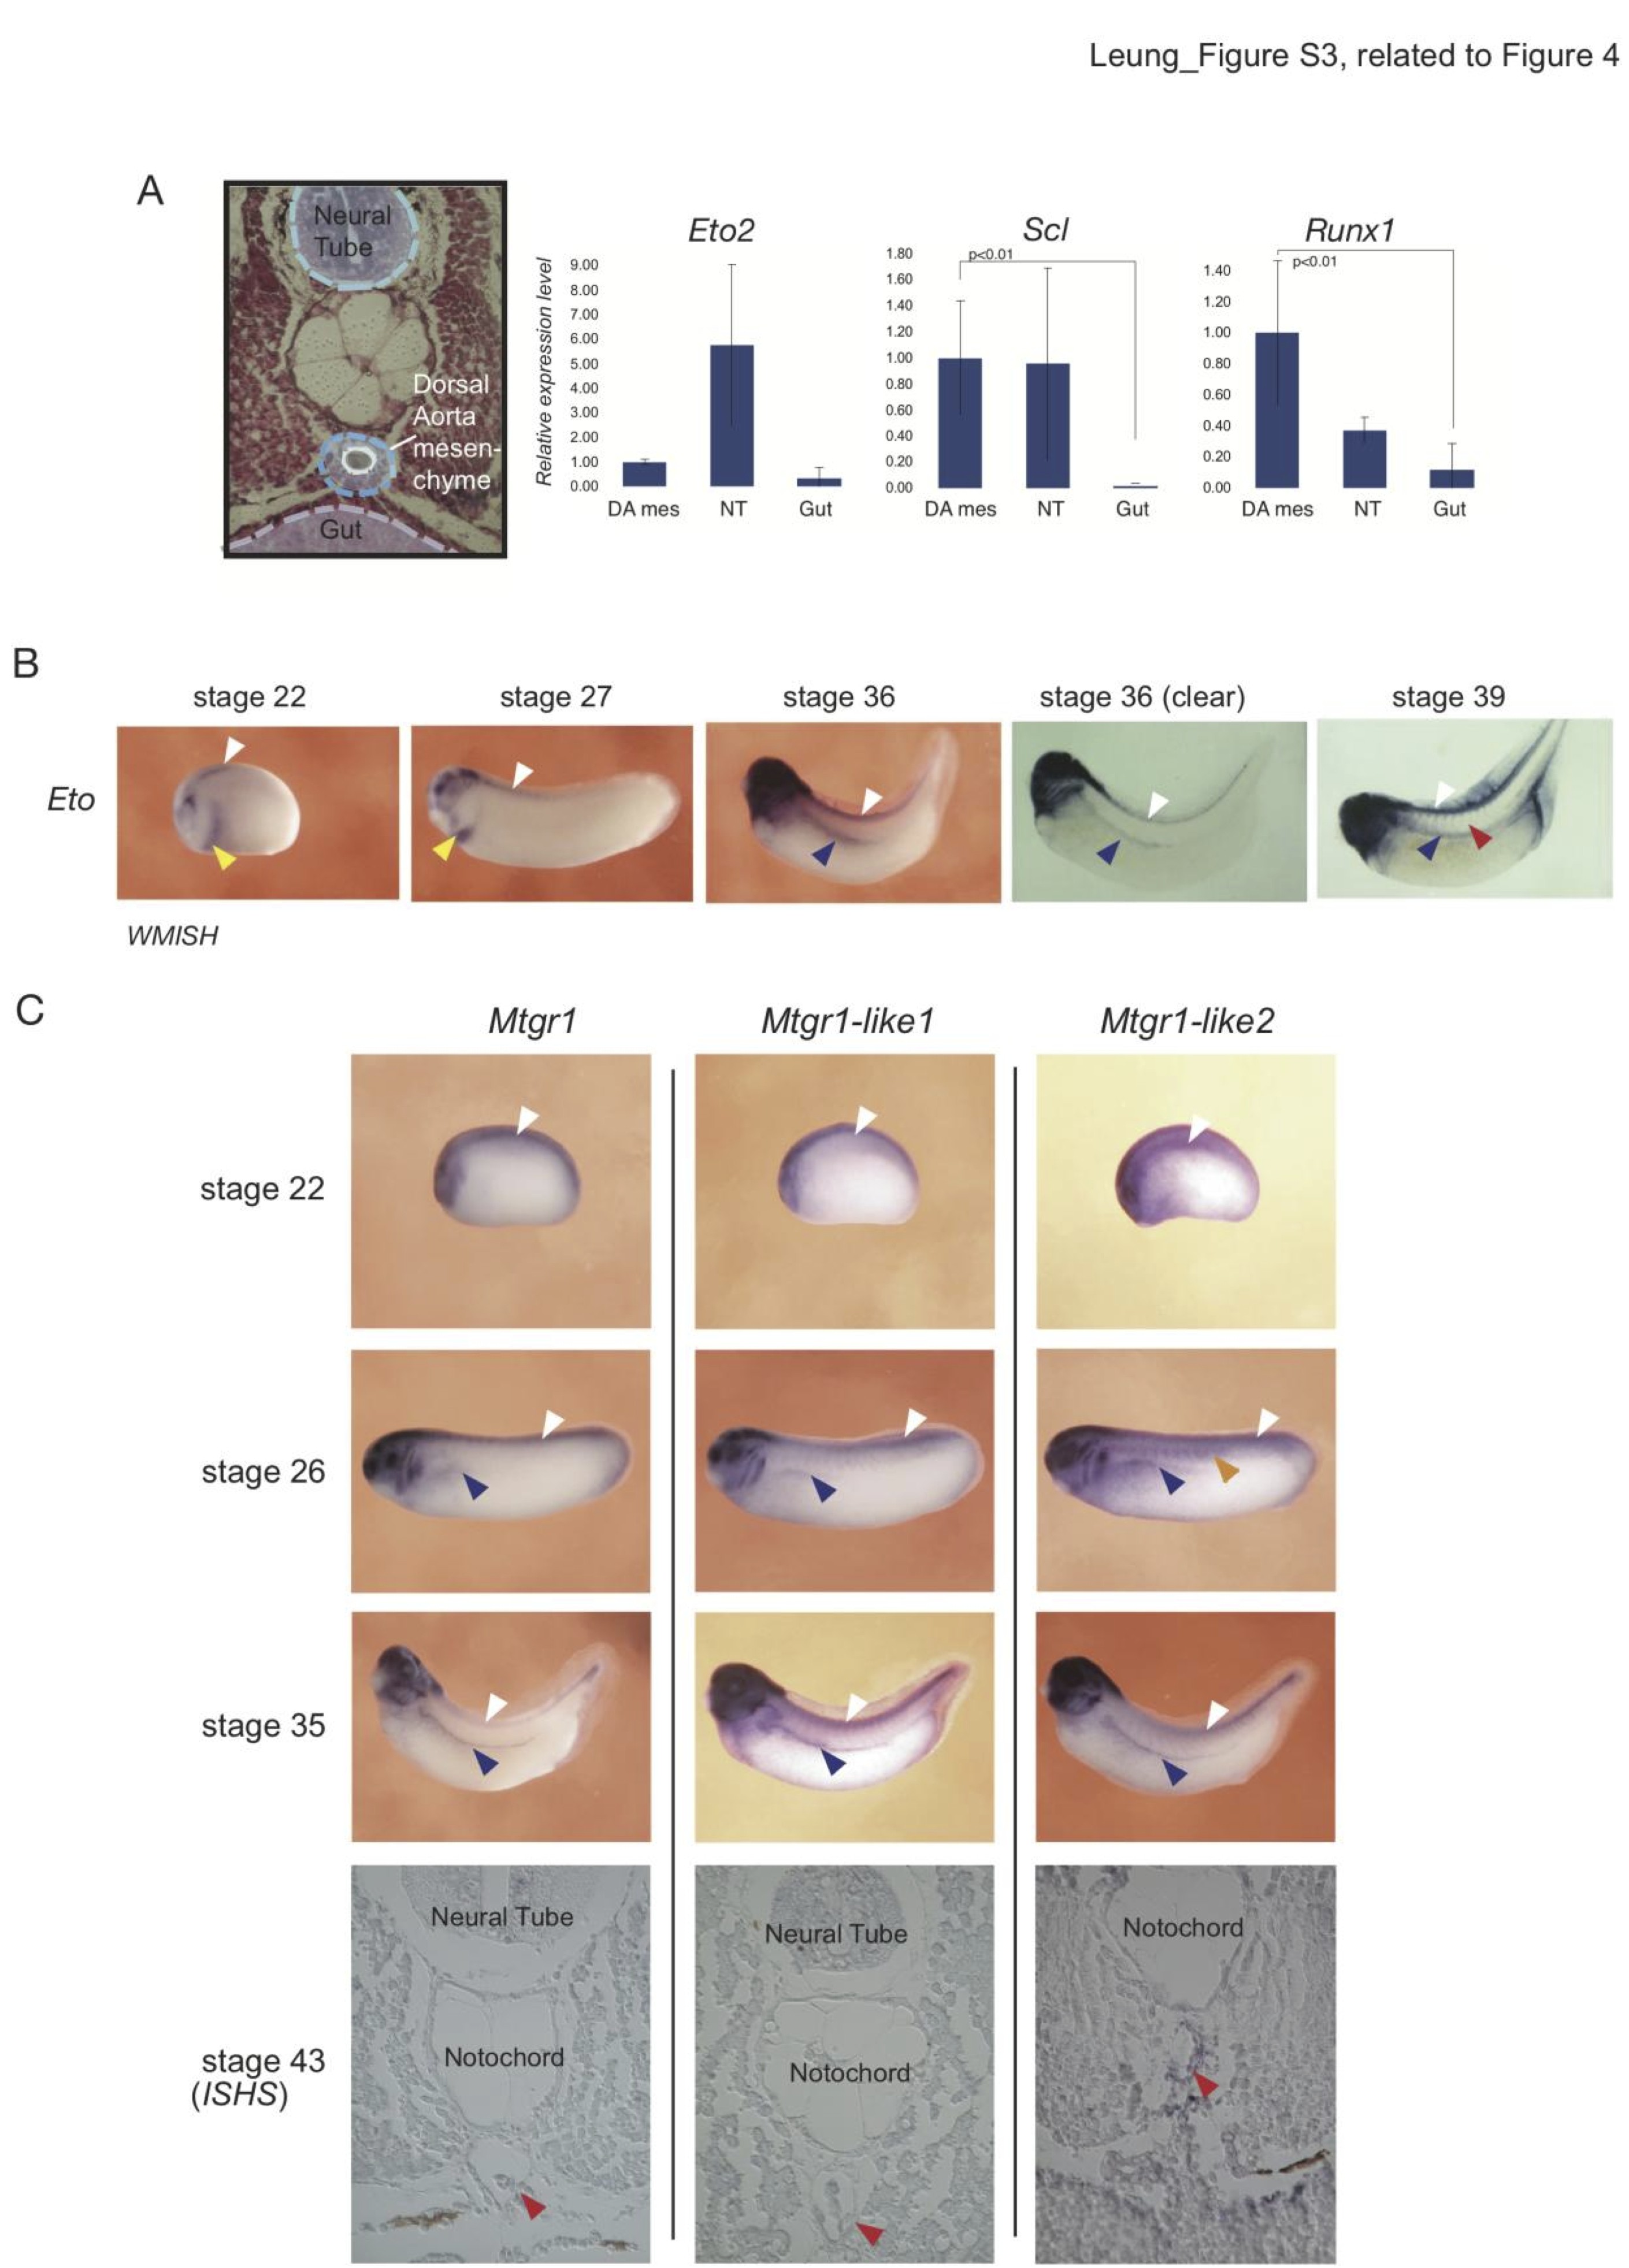
Figure S3. Eto2 is not expressed in the DA - Expression pattern of Eto2-related transcripts during development, related to Figure 4. Figure S3. Related to Figure 4. Eto2 is not expressed in the DA - Expression pattern of Eto2- related transcripts during development (A) Laser Capture Microdissection (LCM) was used to isolate specific tissues from stage 39 embryonic sections; the DA and surrounding mesenchyme (DA mes), the neural tube (NT) and gut. NT tissues were intended as a positive control for amplification of the Eto2 transcripts and the gut as a negative control (as expected from WMISH and ISHS results, Figure 4). Gene expression analysis was carried out for Eto2 and the known HSC markers Scl and Runx1 by Reverse Transcription Real Time PCR. Results were normalised to ODC. Errors bars represent the standard deviation from two independent experiments. Unlike the HSC markers, Eto2 expression in the DA mesenchyme is not significantly different from that observed in gut when compared to the high levels observed in the NT. (B, C) Expression of Eto, Mtgr1, Mtgr1-like1 and Mtgr1-like2 was examined during Xenopus development (B) Expression of Eto is detected in the heart fields (stage 22, yellow arrowhead), in the heart (stage 27, yellow arrowhead), in neural cells (stage 22; neural tube at stages 27, 36, 39, white arrowheads) and in the PCV (stages 36/39, blue arrowhead). There was no expression in the DA at stage 39 (red arrowhead). (C) Expression of Mtgr1, Mtgr1-like1 and Mtgr1-like2 is observed in neural cells (white arrowheads stage 22; neural tube at stages 26 and 35), and in the PCV (initiates anteriorly at stage 26, is established by stage 35; blue arrowheads). Mtgr1-like2 is expressed at low levels in the somites (stage 26, orange arrowhead). ISHS at stage 43 shows no expression of Mtgr1 and Mtgr1-like1 in the DA (red arrowhead) and a faint staining for Mtgr-like2 in the region of the DA and surrounding mesenchyme. However, given the lack of homology in the sequences targeted by the Eto2 MOs, it is highly unlikely that expression of Mtgr-like2 was affected in the knock-down experiments. Whole mounts are shown with anterior to the left and dorsal to the top. Sections are in transverse orientation with dorsal to the top.
Image published in: Leung A et al. (2013)
© 2013 ELL & Excerpta Medica. Creative Commons Attribution license
Permanent Image Page
Printer Friendly View
XB-IMG-84651