Click here to close Hello! We notice that you are using Internet Explorer, which is not supported by Xenbase and may cause the site to display incorrectly. We suggest using a current version of Chrome, FireFox, or Safari.
XB-IMG-153957

Xenbase Image ID: 153957
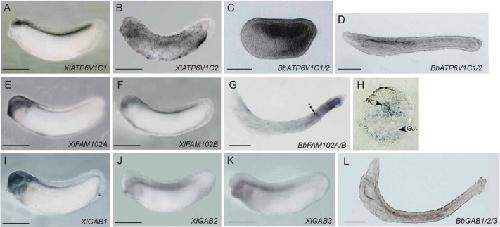
Fig. S5. Expression patterns of 3 shifted expressed gene families: APT6V1C (A–D), FAM102 (E–H) and GAB (I–L). C: amphioxus embryos at 12 h post-fertilization. D: amphioxus larva at 24 h post-fertilization. H: cross section at the position indicated in G. G: the expression was detected in the notochord (NC) and gut. Scale bars: 1 mm (A, B, E, F, I–K); 100 μm (C, D, G, L).

Image published in: Ding Y et al. (2011)

Copyright © 2011. This image is reproduced with permission of the publisher and the copyright holder. This is an Open Access article distributed under the terms of the Creative Commons Attribution License.

GeneSynonymsSpeciesStage(s)Tissue
atp6v1c1.LX. laevisThroughout NF stage 32brain
spinal cord
central nervous system
atp6v1c2.LX. laevisThroughout NF stage 32proctodeum
ciliated epidermal cell
eeig1.Lfam102a, Xlfam102aX. laevisThroughout NF stage 32brain
spinal cord
head
eeig2.Lfam102b, Xlfam102bX. laevisThroughout NF stage 32brain
diencephalon
hindbrain
spinal cord
central nervous system
gab1.LX. laevisThroughout NF stage 32brain
forebrain
telencephalon
diencephalon
midbrain
hindbrain
spinal cord
pharyngeal arch
eye
central nervous system
gab2.LX. laevisThroughout NF stage 32spinal cord
gab3.LX. laevisThroughout NF stage 32spinal cord

Image source: Published

Larger Image
Printer Friendly View

Return to previous page