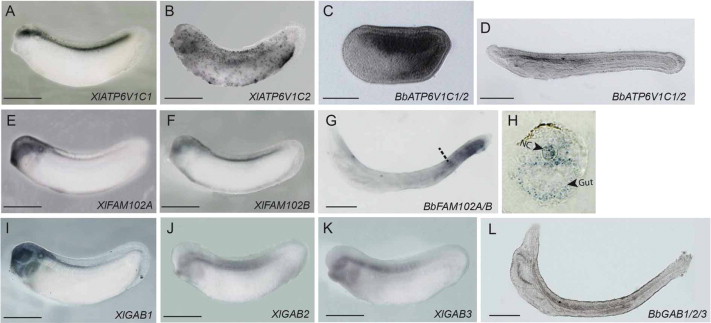
Fig. S5. Expression patterns of 3 shifted expressed gene families: APT6V1C (AâD), FAM102 (EâH) and GAB (IâL). C: amphioxus embryos at 12 h post-fertilization. D: amphioxus larva at 24 h post-fertilization. H: cross section at the position indicated in G. G: the expression was detected in the notochord (NC) and gut. Scale bars: 1 mm (A, B, E, F, IâK); 100 μm (C, D, G, L).
Image published in: Chen Y et al. (2011)
Copyright © 2011. Image reproduced with permission of the Publisher, Elsevier B. V.
| Gene | Synonyms | Species | Stage(s) | Tissue |
|---|---|---|---|---|
| atp6v1c1.L | X. laevis | Throughout NF stage 32 | brain spinal cord central nervous system | |
| atp6v1c2.L | X. laevis | Throughout NF stage 32 | proctodeum ciliated epidermal cell | |
| eeig1.L | fam102a, Xlfam102a | X. laevis | Throughout NF stage 32 | brain spinal cord head |
| eeig2.L | fam102b, Xlfam102b | X. laevis | Throughout NF stage 32 | brain diencephalon hindbrain spinal cord central nervous system |
| gab1.L | X. laevis | Throughout NF stage 32 | brain forebrain telencephalon diencephalon midbrain hindbrain spinal cord pharyngeal arch eye central nervous system | |
| gab2.L | X. laevis | Throughout NF stage 32 | spinal cord | |
| gab3.L | X. laevis | Throughout NF stage 32 | spinal cord |
Image source: Published
Permanent Image Page
Printer Friendly View
XB-IMG-153957