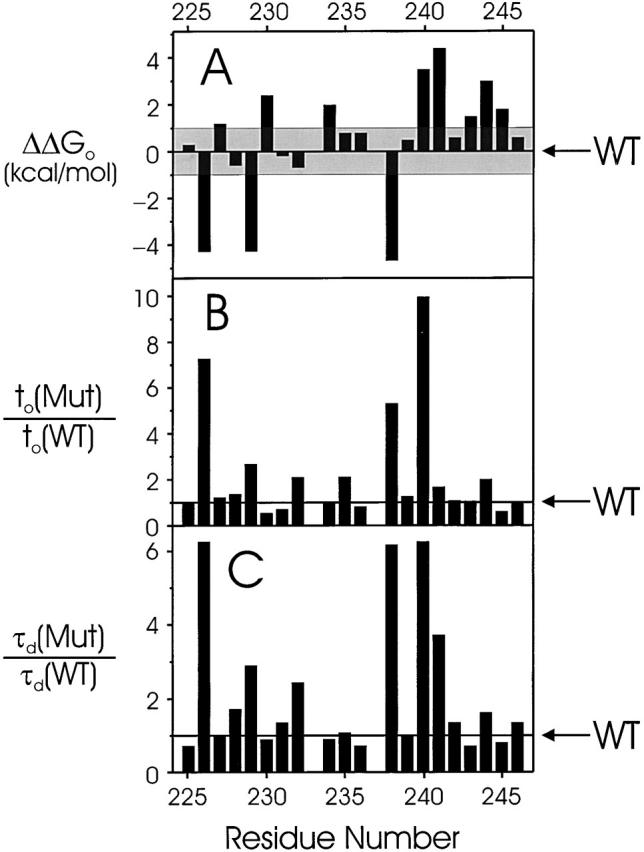
Figure 4. Gating parameters of S1 tryptophan scan. Changes of empirical gating parameters resulting from point Trp mutations are displayed versus residue number. (A) Intrinsic free energy of open-state stabilization, ΔΔGo. The shaded region (|ΔΔGo| < 1 kcal/mol) represents the range of values defining tolerant residues. (B and C) Mutant-to-wild-type ratio of activation times, to, and deactivation time constant, τd, determined as in materials and methods. Electrophysiological parameters are reported in Table .
Image published in: Hong KH and Miller C (2000)
© 2000 The Rockefeller University Press. Creative Commons Attribution-NonCommercial-ShareAlike license
Permanent Image Page
Printer Friendly View
XB-IMG-117080