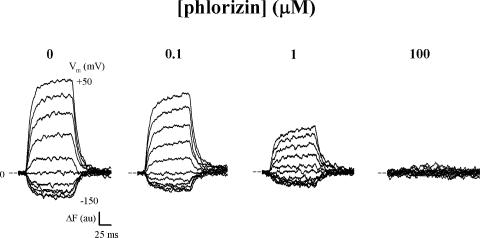
Figure 8. Effect of phlorizin on fluorescence. Shown is the time course of ΔF in NaCl buffer with [phlorizin]o (0, 0.1, 1, and 100 μM) in one oocyte. Membrane potential was held at Vh −50 mV and stepped for 100 ms to Vt (from +50 to −150 mV), before returning to Vh. Abscissa and ordinate scales are the same for all panels.
Image published in: Loo DD et al. (2006)
Copyright © 2006, The Rockefeller University Press. Creative Commons Attribution-NonCommercial-ShareAlike license
Permanent Image Page
Printer Friendly View
XB-IMG-118505