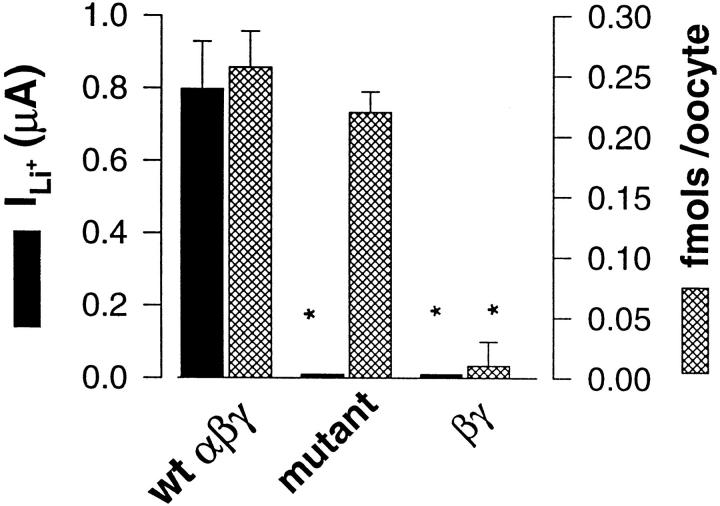
Figure 3. Cell surface expression and macroscopic ILiof wt ENaC (n = 39), triple Cys mutant (αSCβSCγSC) (n = 36) and βγ subunits (n = 41). Filled bars represents ILi. Hatched bars represents specific binding per oocyte of M2AB ([125I]M2IgG1) antibodies (fmols/oocyte) directed against a FLAG epitope introduced in the ectodomain of β and γ wt and mutant subunits. *Denotes statistical significance <0.001.
Image published in: Schild L et al. (1997)
Image reproduced on Xenbase with permission of the publisher and the copyright holder. Creative Commons Attribution-NonCommercial-ShareAlike license
Permanent Image Page
Printer Friendly View
XB-IMG-119821