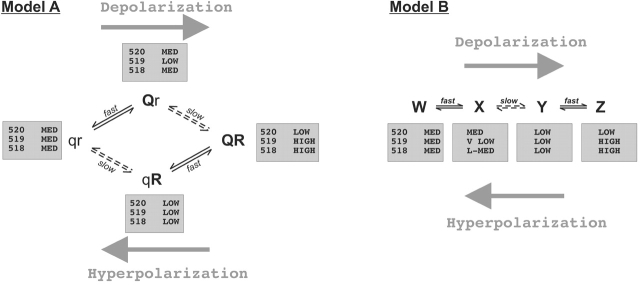
Figure 11. . Two four-state models to describe fluorescence changes observed in HERG. Model A has two voltage dependent transitions, one fast (q → Q) and one slow (r → R). The shaded boxes show relative magnitudes of the fluorescence coefficients used to describe fluorescence changes observed for each mutant. Model B has three sequential voltage dependent transitions.
Image published in: Smith PL and Yellen G (2002)
Copyright © 2002, The Rockefeller University Press. Creative Commons Attribution-NonCommercial-ShareAlike license
Permanent Image Page
Printer Friendly View
XB-IMG-120205