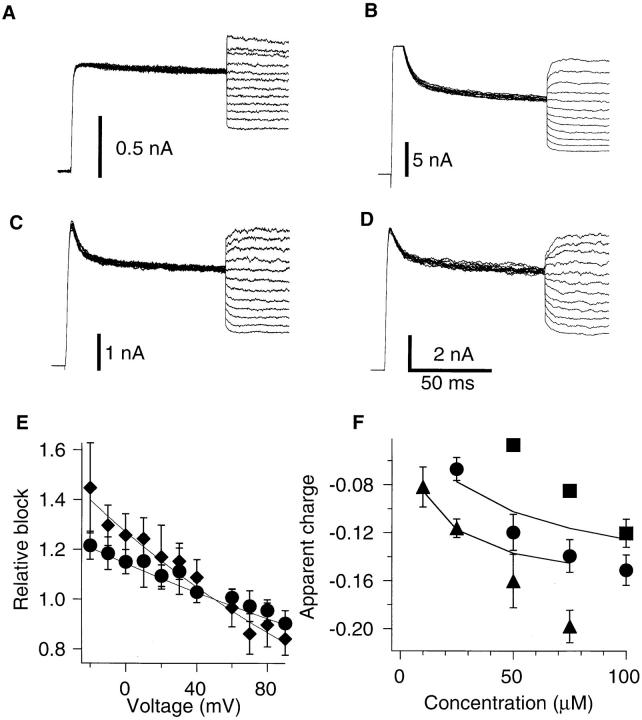
Figure 8. Voltage dependence of DHP block. The currents were first elicited by voltage pulses to +50 mV followed by voltage steps to −20 to +90 mV in 10 mV increments. (A) The ShBΔ6-46 T449V channels do not show significant relaxation after the voltage change. (B) Slow relaxations of the macroscopic currents through the ShBΔ6-46 T449V channels in presence of 25 μM nimodipine. The currents relaxed to lower values at voltages more negative than +50 mV showing more effective block of nimodipine at these voltages. (C) Same as B in presence of 100 μM nifedipine. (D) Voltage-dependent relaxation of the ShBΔ6-46 T449V:A463I current with 100 μM nifedipine. (E) Voltage dependence of the block for ShBΔ6-46 T449V in the presence of 25 μM (diamonds) and 50 μM (circles) of nifedipine. Relative block was calculated as a ratio of the current value immediately after the voltage change over the current value after relaxation based on the single exponential fit of the current decline. The data sets were fitted with function exp [n e (V − 50) / k T] to obtain number of equivalent charges n. (F ) Concentration dependence of the equivalent charges associated with the voltage dependence of the block obtained as described in E for nifedipine block of the ShBΔ6-46 T449V current (circles), ShBΔ6-46 T449V:A463I current (squares), and nimodipine block of ShBΔ6-46 T449V current (triangles). Solid lines represent the scheme SV predictions of nifedipine (upper line) and nimodipine (lower line) block equivalent charges. The model predictions were calculated using the blocking rate constants obtained from the concentration dependence data shown in Fig. 4. Data points represent mean ± standard deviation of five to eight experiments.
Image published in: Avdonin V et al. (1997)
Image reproduced on Xenbase with permission of the publisher and the copyright holder. Creative Commons Attribution-NonCommercial-ShareAlike license
Permanent Image Page
Printer Friendly View
XB-IMG-120463