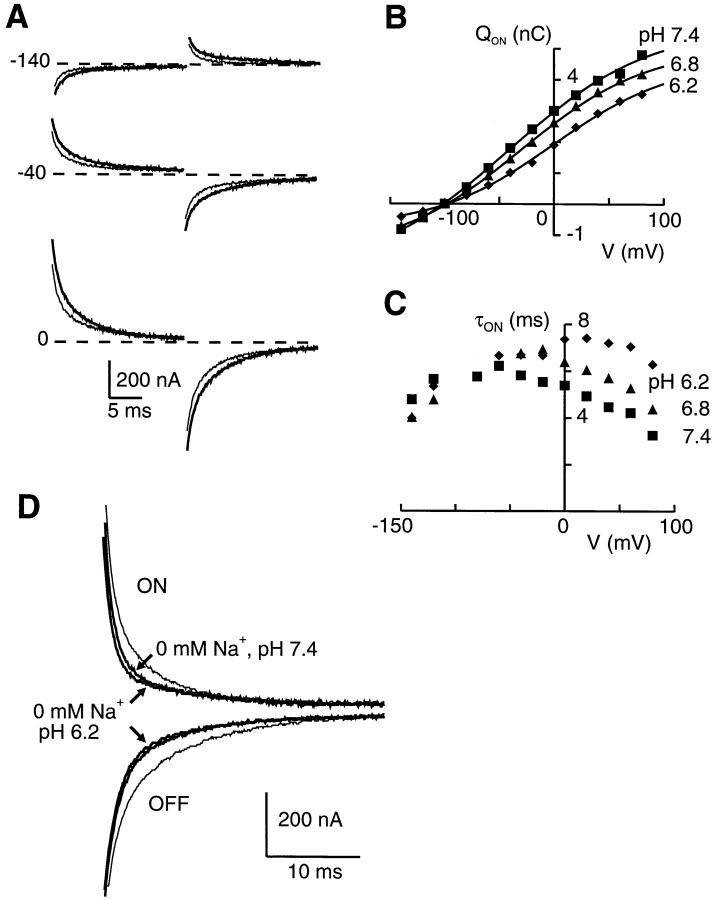
Figure 8. The effect of external pH on pre–steady state relaxations. (A) Superimposed pre–steady state relaxations for ON and OFF voltage steps to the test potentials indicated from a holding potential of −100 mV for the same cell with 96 mM Na+ in external medium. Thick traces, pH 7.4; thin traces, pH 6.2. To suppress the endogenous capacitive transient, the records were blanked for the first 3 ms after the transition. (B) Apparent charge movement for three pHs indicated in the presence of 96 mM Na+. Continuous lines are fits using the Boltzmann function (Eq. 2). The fit parameters were: (pH 7.4) z = 0.38, V0.5 = −40 mV, Qmax = 7.4 nC; (pH 6.8) z = 0.37, V0.5 = −23 mV, Qmax = 7.5 nC; (pH 6.2) z = 0.46, V0.5 = −2 mV, Qmax = 5.3 nC. (C) Voltage dependence of main ON relaxation τ for three pHs indicated and the same cell as in B. (D) Pre–steady state relaxations recorded from another cell for a step from −100 to 0 mV (ON) and returning to −100 mV (OFF) for three superfusion conditions: 96 mM Na+, pH 7.4 (thin trace); 0 mM Na+, pH 7.4, and 0 mM Na+, pH 6.2 (arrows). The graphical superposition of the traces reveals that after removal of Na+ from the external medium, a reduction in pH leads to a further suppression of the relaxations. To suppress the endogenous capacitive transient, the records are blanked for the first 3 ms after the transition.
Image published in: Forster I et al. (1998)
Image reproduced on Xenbase with permission of the publisher and the copyright holder. Creative Commons Attribution-NonCommercial-ShareAlike license
Permanent Image Page
Printer Friendly View
XB-IMG-120855