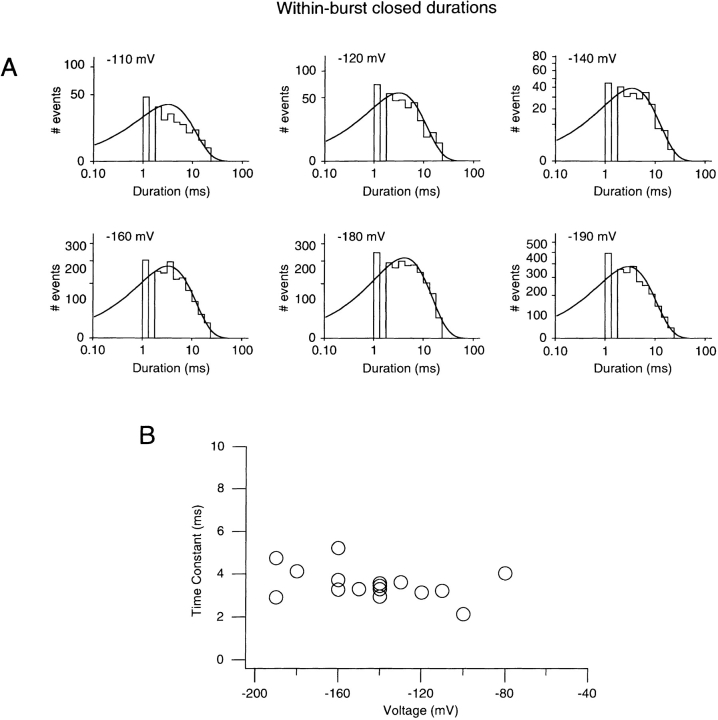
Figure 8. (A) Frequency histograms of within-burst closed durations measured at several voltages from KAT1 channels. A burst criterion of 20 ms was used. The solid lines represent single exponential fits to the data. (B) Time constants derived from the exponential fits to the within-burst closed time duration histograms are plotted as a function of voltage.
Image published in: Zei PC and Aldrich RW (1998)
Image reproduced on Xenbase with permission of the publisher and the copyright holder. Creative Commons Attribution-NonCommercial-ShareAlike license
Permanent Image Page
Printer Friendly View
XB-IMG-120963