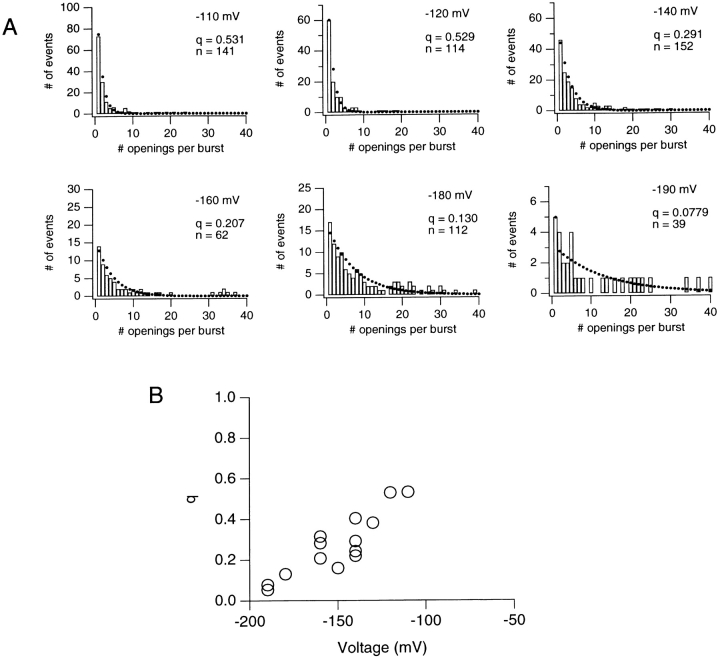
Figure 10. (A) Frequency histograms of the number of openings per burst at several voltages, using a burst criterion of 20 ms. The data are fitted by a geometric distribution (Eq. 6), represented by the dots. The probability of terminating a burst (q) and the total number of openings are shown for each voltage. (B) The probability of terminating a burst (q), derived from the geometric fits, is plotted as a function of voltage.
Image published in: Zei PC and Aldrich RW (1998)
Image reproduced on Xenbase with permission of the publisher and the copyright holder. Creative Commons Attribution-NonCommercial-ShareAlike license
Permanent Image Page
Printer Friendly View
XB-IMG-120969