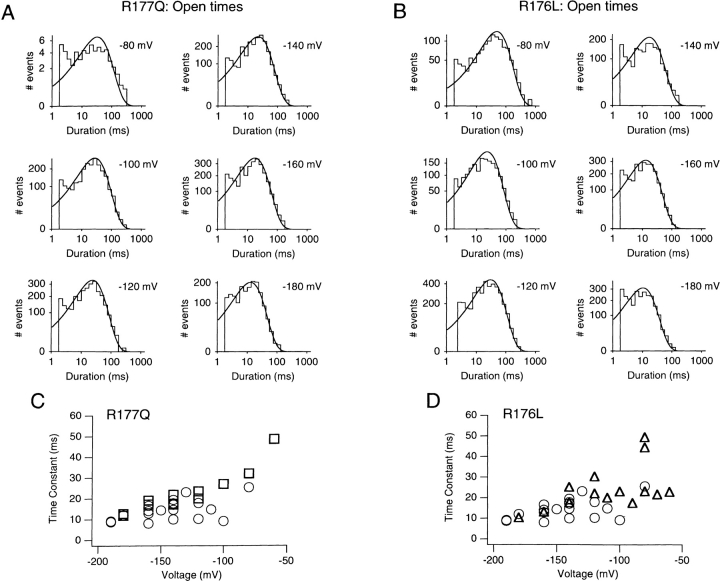
Figure 19. (A) Frequency histograms of open durations measured at several voltages from R177Q channels, with voltages as indicated. The data were fitted with single exponential functions, represented by the solid curves and displayed as described in methods. (B) Frequency histograms of open durations measured at several voltages from R176L channels, with voltages as indicated. The data were fitted with single exponential functions, represented by the solid curves and displayed as described in methods. (C) Voltage dependence of the time constants derived from exponential fits to open time distributions for R177Q currents (□). Open duration time constants for wild-type KAT1 currents are superimposed (○). The data points represent several patches. The open duration distribution time constants have been corrected for missed events as described in methods. (D) Voltage dependence of the time constants derived from the exponential fits to open time distributions for R176L currents (▵). Open duration time constants for wild-type KAT1 currents are superimposed (○). The data points represent several patches.
Image published in: Zei PC and Aldrich RW (1998)
Image reproduced on Xenbase with permission of the publisher and the copyright holder. Creative Commons Attribution-NonCommercial-ShareAlike license
Permanent Image Page
Printer Friendly View
XB-IMG-120974