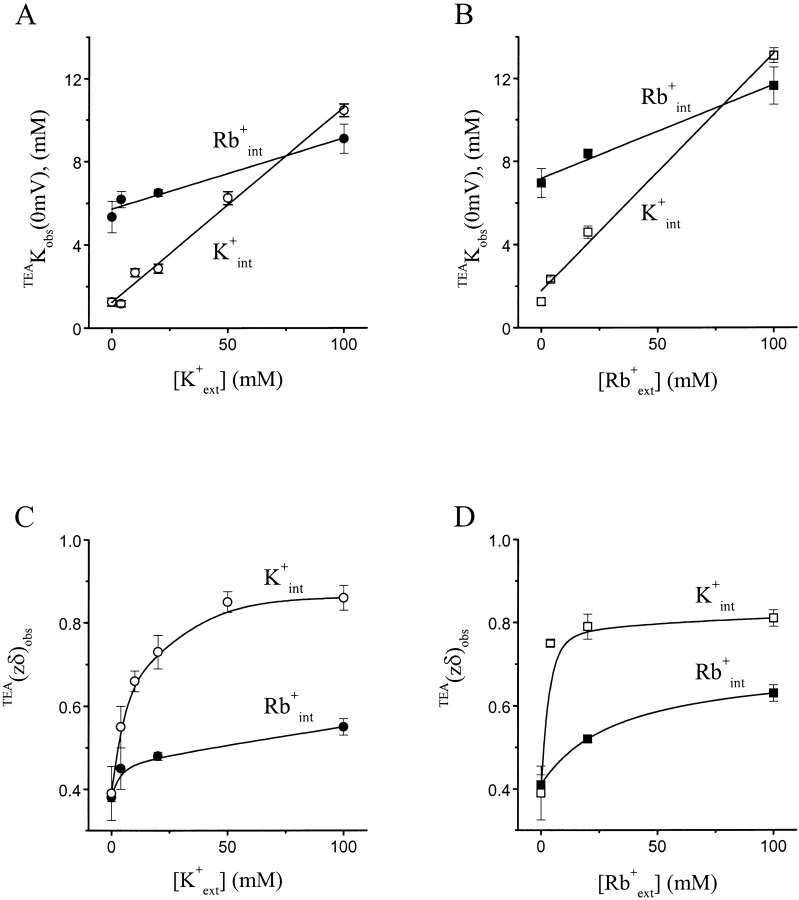
Figure 7. Effects of intracellular permeant ions on channel blockade by intracellular TEA. (A and B) TEAKobs(0 mV) (mean ± SEM, n = 5) are plotted against the concentration of extracellular K+ in A and Rb+ in B. Data in the open symbols were obtained in 100 mM intracellular K+, while data in the closed symbols were obtained in 100 mM intracellular Rb+. The lines superimposed on the data correspond to . (C and D) The values of TEA(zδ)obs (mean ± SEM, n = 5) are plotted against the concentration of extracellular K+ in C and Rb+ in D. Data in the open symbols were obtained in 100 mM intracellular K+, while data the in closed symbols were obtained in 100 mM intracellular Rb+. The curves superimposed on the data have no theoretic meaning.
Image published in: Spassova M and Lu Z (1999)
© 1999 The Rockefeller University Press. Creative Commons Attribution-NonCommercial-ShareAlike license
Permanent Image Page
Printer Friendly View
XB-IMG-121022