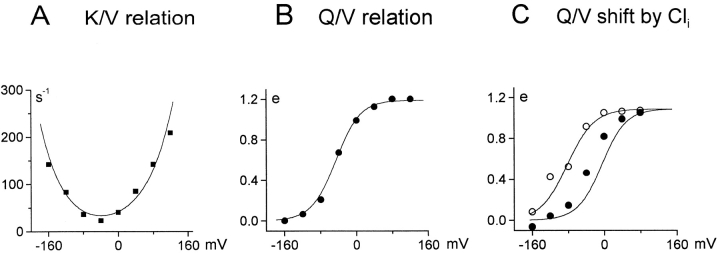
Figure 11. Rate– (K/V) and charge–voltage (Q/V) relations. (A and B) Results from an excised oocyte patch with 40 mM extracellular NaCl, simulated with 80 mM NaCl. (C) Effect of 120 mM cytoplasmic Cl− on Q/V relation of a patch with 120 mM extracellular NaCl. The simulated charge is calibrated as elementary charges (e) moved through membrane field per single transporter. See text for details.
Image published in: Hilgemann DW and Lu CC (1999)
© 1999 The Rockefeller University Press. Creative Commons Attribution-NonCommercial-ShareAlike license
Permanent Image Page
Printer Friendly View
XB-IMG-121046