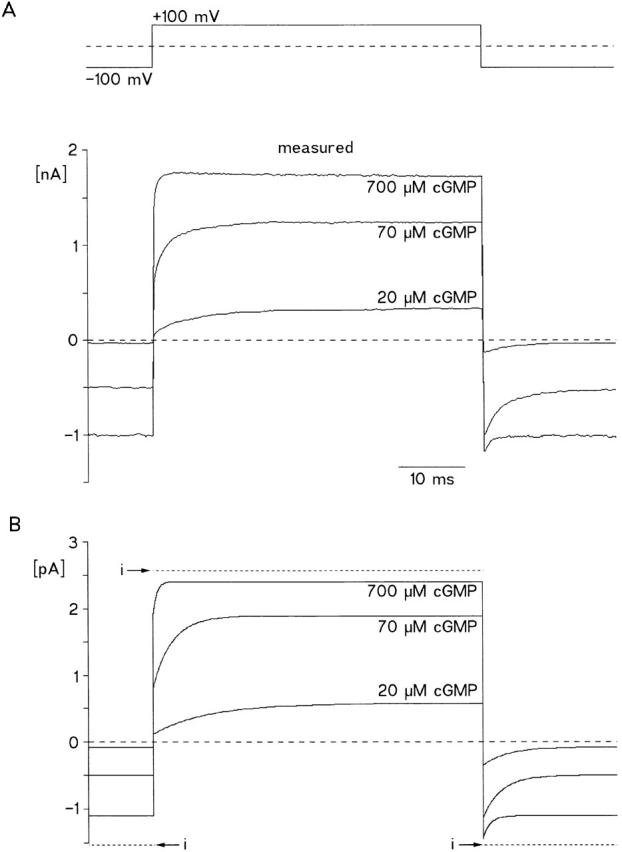
Figure 8. Comparison of computed with measured currents at three [cGMP] and voltage steps of 50-ms duration from −100 to +100 mV. (A) Measured currents. The currents at 70 and 700 μM cGMP were recorded from the same patch. The current at 20 μM [cGMP] was recorded from another patch and it was scaled with the ratio of currents at 700 μM [cGMP] in the two patches. (B) Computed currents. Po was calculated with the allosteric model (Fig. 1) and then scaled with the mean single channel current (dotted lines; −1.6 pA at −100 mV; 2.6 pA at +100 mV). The parameters were: k1 = 3 × 10⁷ M−1 s−1, k2 = 1.5 × 10³ s−1, k3,0 = 1.39 × 10³ s−1, k4,0 = 1.67 × 10² s−1, z = 0.23.
Image published in: Benndorf K et al. (1999)
© 1999 The Rockefeller University Press. Creative Commons Attribution-NonCommercial-ShareAlike license
Permanent Image Page
Printer Friendly View
XB-IMG-121062