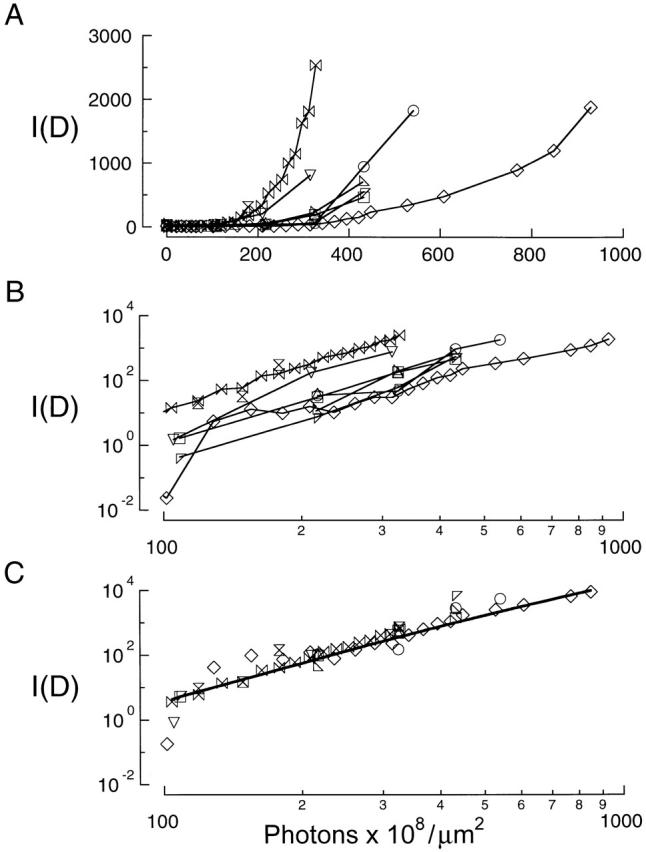
Figure 5. Dose dependence of UV-activated conductance. (A) UV dose–response relations for UV-activated conductances from nine patches. The total patch current in picoamperes is plotted as a function of the cumulative photon dose. Different symbols indicate separate experiments. Patches were irradiated while held at 0 mV and currents were recorded at +50 mV. The bath and pipet contained standard sodium solution with no cGMP (see materials and methods). (B) Results from A, plotted on double logarithmic coordinates. (C) Same as B, except the results from each experiment were shifted along the ordinate to correct for the difference in current amplitudes at 3 × 10¹⁰ photons · μm−2. The solid line is a fit to the combined results using the modified all-or-none model () with the target number n* equal to 4.3 ± 0.5. Currents in A–D were corrected for leak through the seal resistance by subtracting the current before irradiation.
Image published in: Middendorf TR et al. (2000)
© 2000 The Rockefeller University Press. Creative Commons Attribution-NonCommercial-ShareAlike license
Permanent Image Page
Printer Friendly View
XB-IMG-121120