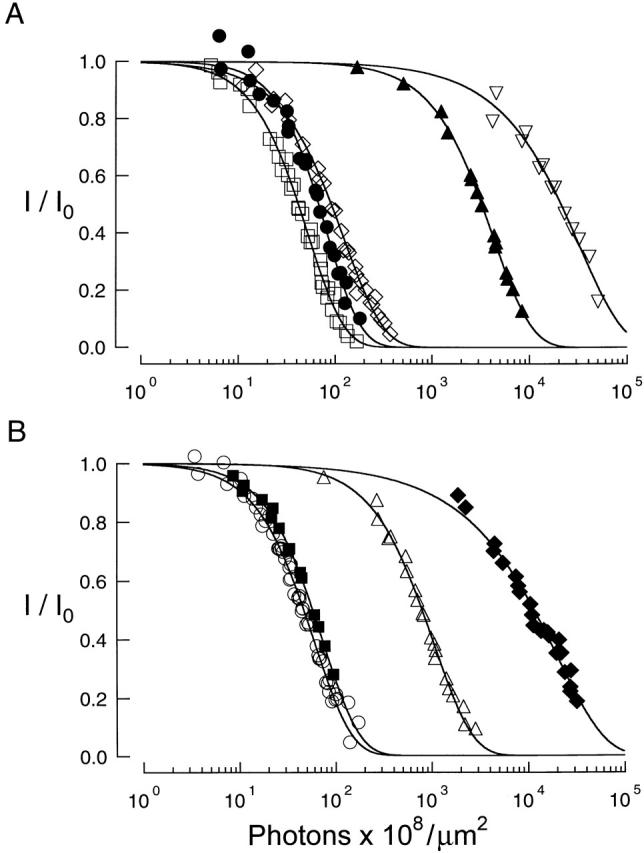
Figure 8. UV dose–response relations of RET channels irradiated at different wavelengths. (A) The channel current amplitude in saturating (1 mM) cGMP, I, normalized by the pre-UV amplitude, I0, is plotted as a function of UV dose on semilogarithmic coordinates. Each type of symbol represents collected results from 3–10 separate patches at a given wavelength. The UV dose that reduced the current to half of its initial value, D1/2, was estimated from fits to the results for each experiment using . To facilitate comparison of the shapes of the relations, the results from each experiment were shifted along the abscissa so that D1/2 was equal to the average D1/2 of the unshifted results for all experiments at the same wavelength. Smooth curves are fits to the collected results at each wavelength using . The excitation wavelengths, symbols, and number of experiments were: 250 nm (•), 3; 270 nm (□), 4; 290 nm (⋄), 3; 310 nm (▴), 3; and 330 nm (▿), 2. The light source was a xenon arc lamp; light intensities ranged from 1.3 × 10⁷ to 2.7 × 10⁹ photons · μm−2 · s−1. Currents through channels activated by 1 mM (saturating) cGMP were recorded at +50 mV. Cyclic GMP was absent during irradiation. (B) Same as A, except the wavelengths, symbols, and number of experiments were: 260 nm (▪), 3; 280 nm (○), 10; 300 nm (▵), 4; and 320 nm (♦), 4.
Image published in: Middendorf TR et al. (2000)
© 2000 The Rockefeller University Press. Creative Commons Attribution-NonCommercial-ShareAlike license
Permanent Image Page
Printer Friendly View
XB-IMG-121123