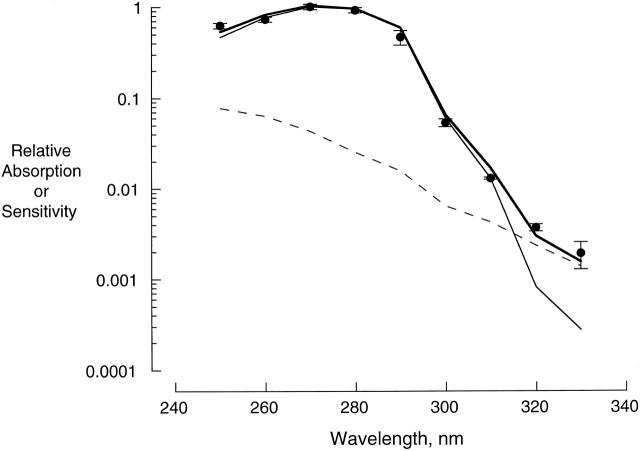
Figure 16. Contribution of cystine photolysis to UV effect on CNG channels. Symbols show the action spectrum of the UV effect on RET channels (mean ± SEM, •, results from Fig. 9 A). Also shown is a fit to the action spectrum (bold line) using a linear combination of the filter-corrected absorption spectra (see materials and methods and Fig. 3) of tryptophan (thin line) and cystine (dashed line) in aqueous buffer. Relative contributions of the spectral components were 1.0 for tryptophan and 0.93 for cystine.
Image published in: Middendorf TR et al. (2000)
© 2000 The Rockefeller University Press. Creative Commons Attribution-NonCommercial-ShareAlike license
Permanent Image Page
Printer Friendly View
XB-IMG-121131