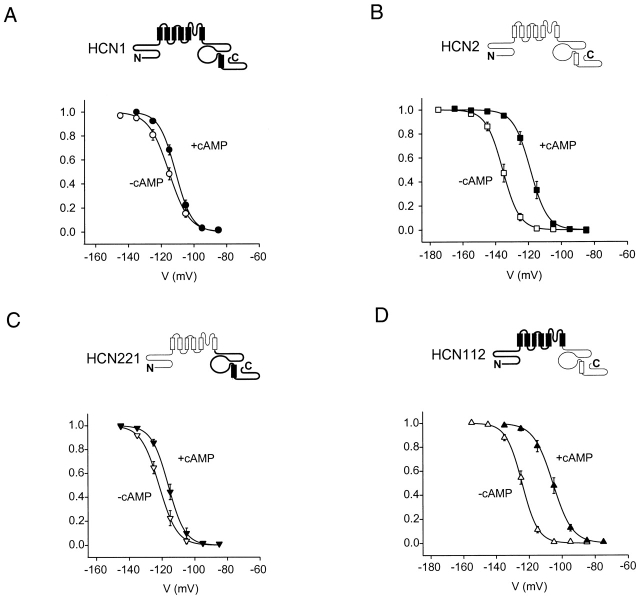
Figure 2. Tail current activation curves for HCN1, HCN2, and COOH-terminal chimeras in the absence and presence of cAMP. Mean, normalized tail current amplitudes (materials and methods) are plotted on the y-axis as a function of test voltage. Solid curves show fitted Boltzmann relation. (closed symbols) In the presence of cAMP; (open symbols) in the absence of cAMP. Bars indicate SEM. (A) HCN1. V1/2 and s values from fitted Boltzmann relations are, respectively, −115.3 and 6.2 mV in the absence of cAMP and −111.2 and 5.0 mV in the presence of cAMP (n = 7 patches). (B) HCN2. V1/2 and s equal −135.7 and 5.1 mV, respectively, in the absence of cAMP, and −118.8 and 5.2 mV in the presence of cAMP, respectively (n = 10). (C) HCN221. V1/2 and s values from fitted Boltzmann relations are, respectively, −121.8 and 5.5 mV in the absence of cAMP and −116.2 and 5.1 mV in the presence of cAMP (n = 6). (D) HCN112. V1/2 and s values from fitted Boltzmann relations are, respectively, −124.4 and 4.8 mV in the absence of cAMP and −105.7 and 5.8 mV in the presence of cAMP (n = 10 patches).
Image published in: Wang J et al. (2001)
© 2001 The Rockefeller University Press. Creative Commons Attribution-NonCommercial-ShareAlike license
Permanent Image Page
Printer Friendly View
XB-IMG-121133