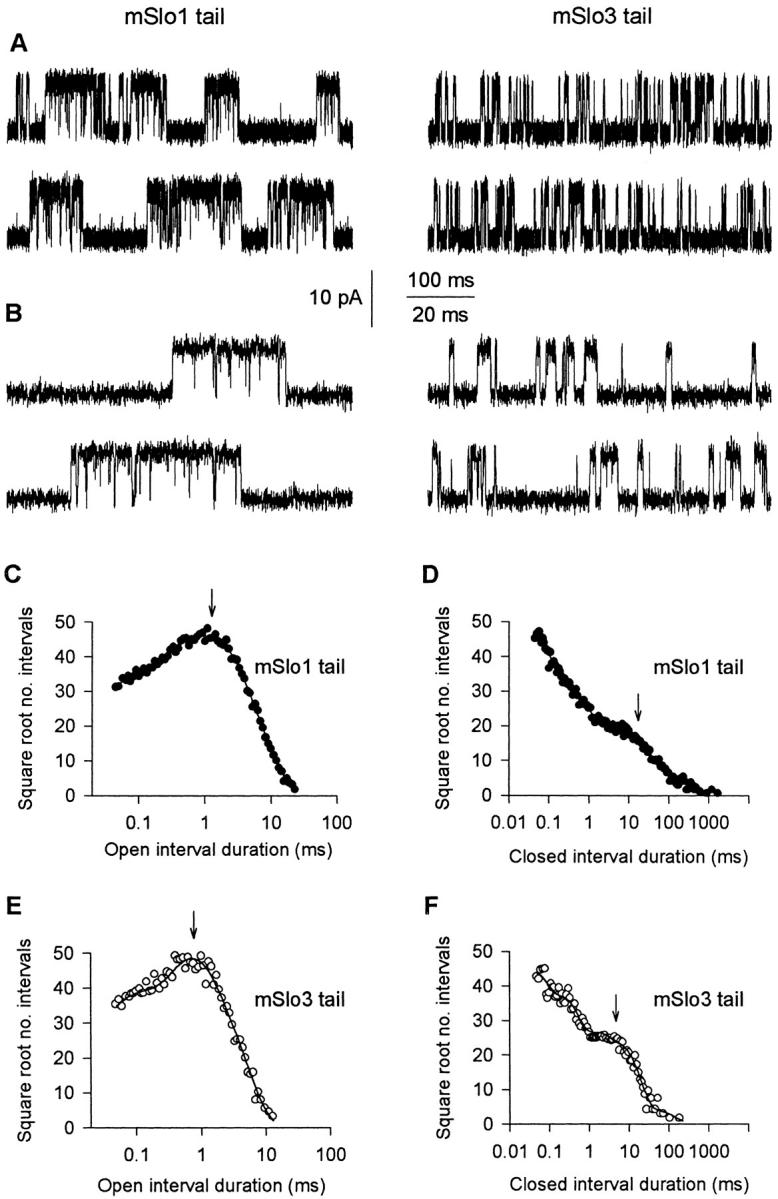
Figure 7. Replacing the mSlo1 tail with the mSlo3 tail decreases burst duration. (A) Single-channel current recordings from patches containing a single mSlo1 tail channel and a single mSlo3 tail channel. For the mSlo1 tail channel, Ca2+i = 15.2 μM and PO = 0.30. For the mSlo3 tail channel, Ca2+i = 0 μM and PO = 0.34. Membrane potential: +30 mV. Both recordings were low-pass filtered at 8 kHz. (B) Representative bursts of openings from A on a faster time base. (C–F) Open and closed 1-D dwell-time distributions for the mSlo1 tail channel (C and D) and mSlo3 tail channel (E and F) shown in A and B. The distributions have been scaled to contain the same number of intervals (100,000) to facilitate comparison. The arrows indicate the mean open times and the mean durations of the gaps between bursts. The time constants and areas of the exponential components are as follows. (C, open) 0.05 ms, 0.16; 0.27 ms, 0.20; 1.08 ms, 0.39; 2.57 ms, 0.25. (D, closed) 0.03 ms, 0.44; 0.11 ms, 0.21; 0.35 ms, 0.15; 1.17 ms, 0.08; 6.15 ms, 0.08; 22.94 ms, 0.04. (E, open) 0.06 ms, 0.23; 0.56 ms, 0.45; 1.49 ms, 0.32. (F, closed) 0.03 ms, 0.40; 0.19 ms, 0.32; 1.10 ms, 0.13; 5.74 ms, 0.15.
Image published in: Moss BL and Magleby KL (2001)
© 2001 The Rockefeller University Press. Creative Commons Attribution-NonCommercial-ShareAlike license
Permanent Image Page
Printer Friendly View
XB-IMG-121145