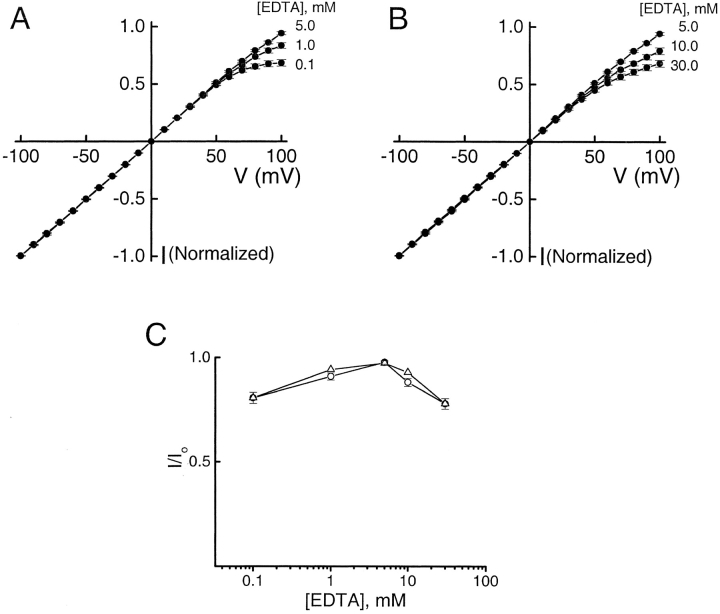
Figure 6. . Effects of EDTA concentration on the I-V curves of IRK1 channels. Normalized I-V curves in the presence of various concentrations of EDTA. For clarity, I-V curves with 0.1–5 mM intracellular EDTA (A) are plotted separately from those with 5–30 mM EDTA (B). All data points are mean ± SEM (n = 4–6). (C) Normalized current at 80 mV, taken from the I-V curves in A and B, is plotted against the concentration of EDTA. The data represented by the circles (mean ± SEM) were determined experimentally, whereas those by triangles were calculated using Eq. 1, as described in discussion.
Image published in: Guo D and Lu Z (2002)
Copyright © 2002, The Rockefeller University Press. Creative Commons Attribution-NonCommercial-ShareAlike license
Permanent Image Page
Printer Friendly View
XB-IMG-121179