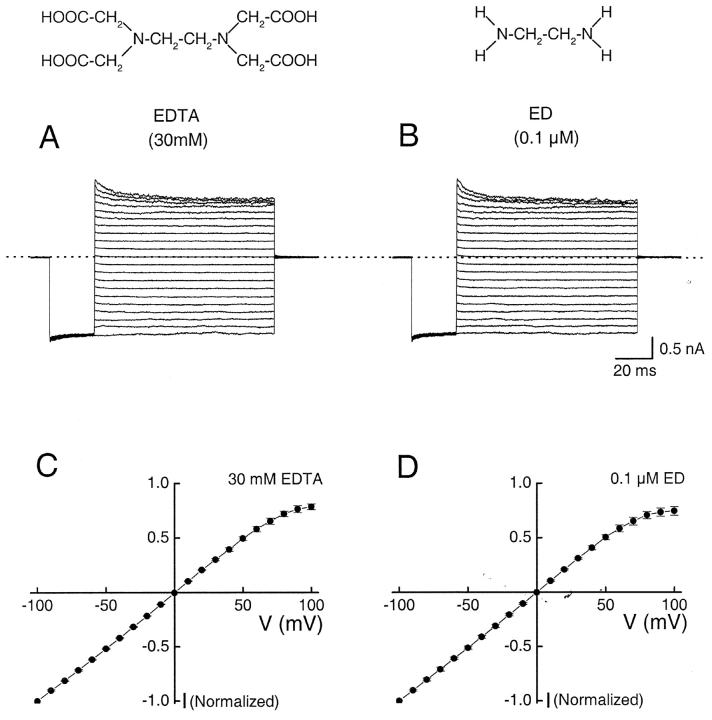
Figure 8. . Comparisons of the effects on IRK1 currents of intracellular EDTA and ethylenediamine (structures shown at top). (A and B) Currents were recorded from the same membrane patch with, respectively, 30 mM EDTA and 0.1 μM ethylenediamine. (C and D) Normalized I-V curves; each data point represents the mean (± SEM; n = 5) of currents.
Image published in: Guo D and Lu Z (2002)
Copyright © 2002, The Rockefeller University Press. Creative Commons Attribution-NonCommercial-ShareAlike license
Permanent Image Page
Printer Friendly View
XB-IMG-121181