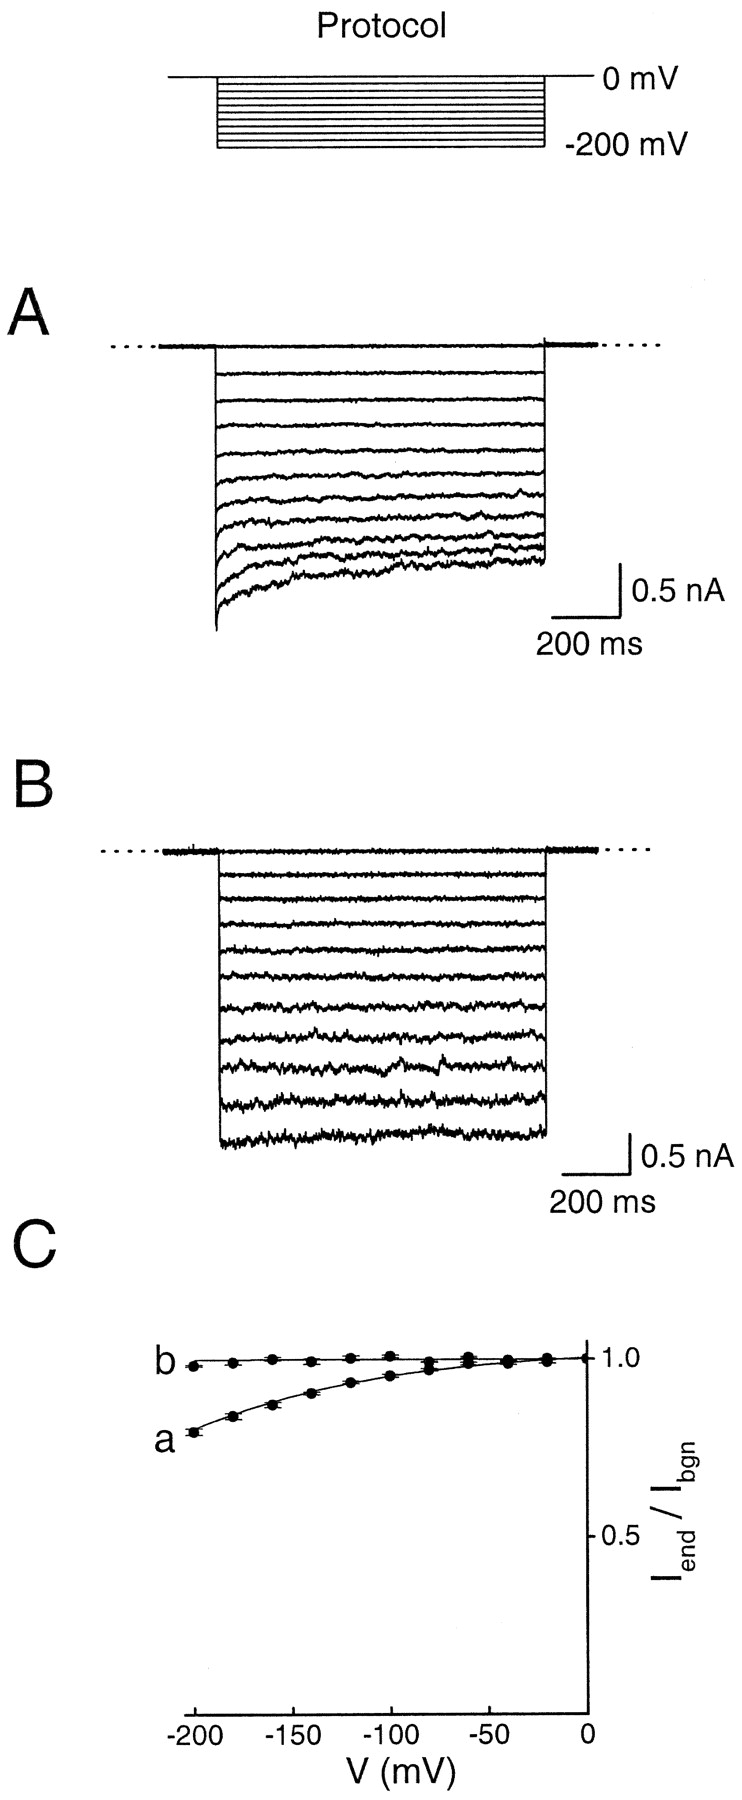
Figure 12. . Relaxation of inward currents caused by extracellular divalent cations. Currents were recorded with the voltage protocol shown at the top. Intra- and extracellular solutions were buffered with 10 mM phosphate. The extracellular solution contained 0.3 mM Ca2+ and 1 mM Mg2+ in A, but 5 mM EDTA and no added Ca2+ or Mg2+ in B. (C) The ratio of currents at the end and the beginning of voltage pulses (Iend/Ibgn) is plotted against membrane voltage. The data corresponding to A and B are labeled by letters a and b, respectively. All data points are mean ± SEM (n = 5).
Image published in: Guo D and Lu Z (2002)
Copyright © 2002, The Rockefeller University Press. Creative Commons Attribution-NonCommercial-ShareAlike license
Permanent Image Page
Printer Friendly View
XB-IMG-121185