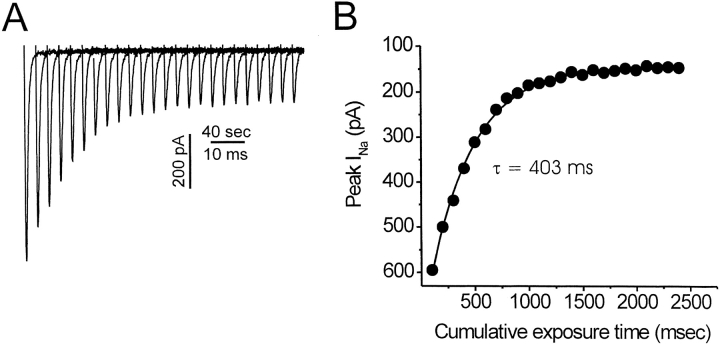
Figure 4. . Measurement of state-dependent modification rate. (A) Na currents elicited by the assay pulses during serial exposures to MTS-ET are shown on a condensed time scale. The top number of the time scale represents the interval elapsed between each assay pulse, and the bottom number represents the time scale relative to individual assay pulses. In this example, accessibility of the E758C residue is being tested by serial 200 ms exposures to 2 mM MTS-ET early during the conditioning pulse (minimally slow inactivated). (B) Peak INa values from A are plotted against the cumulative time of exposure to MTS-ET, and fit with a single exponential decay. The apparent modification rate (RApparent) is then computed from the time constant.
Image published in: Struyk AF and Cannon SC (2002)
Copyright © 2002, The Rockefeller University Press. Creative Commons Attribution-NonCommercial-ShareAlike license
Permanent Image Page
Printer Friendly View
XB-IMG-121191