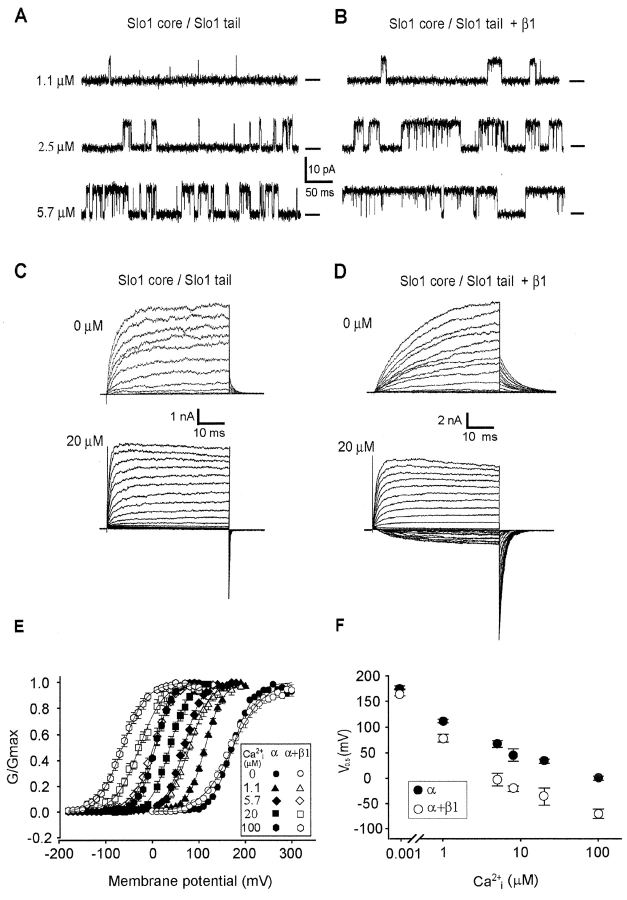
Figure 2. . The β1 subunit increases the apparent Ca2+ sensitivity of the Slo1core/Slo1 tail channels while reducing the voltage sensitivity. (A and B) Representative single-channel current traces recorded from Slo1 core/Slo1 tail channels with and without β1 subunits for 1.1, 2.5, 5.7 μM Ca2+i, as indicated, at 30 mV. (C and D) Representative macrocurrents recorded for 0 and 20 μM Ca2+i with and without the β1 subunit. For currents with 0 Ca2+i, the potential was held at −80 mV, stepped to potentials between 0 and 300 mV in increments of 20 mV, and then stepped to 40 mV to measure tail currents. For currents with 20 μM Ca2+i, the potential was held at −120 mV, stepped to potentials between −100 to 120 mV in increments of 10 mV and then stepped to −80 mV to measure tail currents. (E) G-V curves derived from tail currents of Slo1core/Slo1 tail channels with and without β1 subunits. Each point plots the mean from >5 different patches. The lines in the GV plots in this and later figures are the fitted Boltzmann function with Eq. 1. The average voltage sensitivity was 20.2 ± 1.0 mV/e-fold without the β1 subunit and 26.3 ± 2.1 mV/e-fold with the β1 (F) Plots of the V0.5 versus Ca2+i for experiments like in (E). V0.5 was determined separately for data from each of >5 different patches and then averaged.
Image published in: Qian X et al. (2002)
Copyright © 2002, The Rockefeller University Press. Creative Commons Attribution-NonCommercial-ShareAlike license
Permanent Image Page
Printer Friendly View
XB-IMG-121286