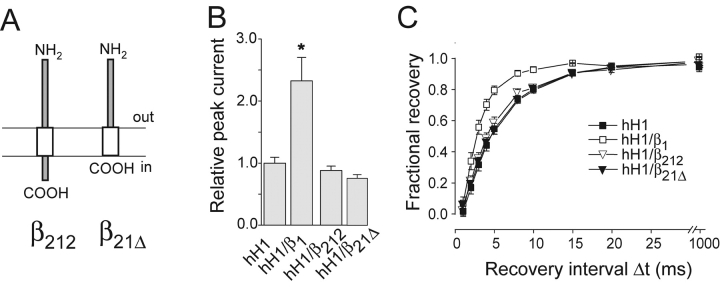
Figure 5. . Coexpression of chimera β212 and β21Δ with hH1 channels. (A) Schematic representation of the domain structure of β212 and β21Δ. (B) Relative current amplitudes (test pulse to −25 mV; *P < 0.001; n = 17 for hH1, n = 10 for hH1/β1, n = 21 for hH1/β212, and n = 11 for β21Δ). (C) Time course of recovery from inactivation of hH1 channels (n = 10 for hH1, n = 4 for hH1/β1, n = 11 for hH1/β212, and n = 7 for β21Δ). Bars indicate SEM.
Image published in: Zimmer T and Benndorf K (2002)
Copyright © 2002, The Rockefeller University Press. Creative Commons Attribution-NonCommercial-ShareAlike license
Permanent Image Page
Printer Friendly View
XB-IMG-121296