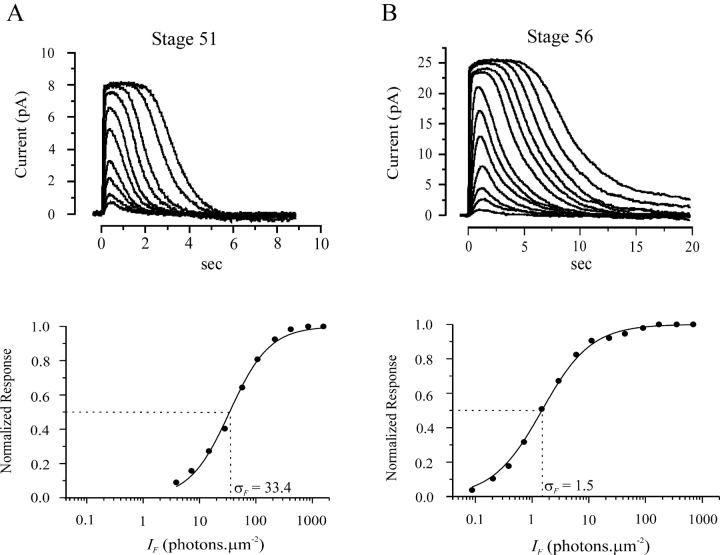
Figure 4. . Rod response properties at stages 51 and 56. In each case, top panel indicates flash response-intensity family from an overnight-dark-adapted rod, and bottom panel shows the relation between peak amplitude and flash intensity of the same cell. (A) Flash intensities were 3.86, 7.18, 14.67, 27.95, 57.07, 106.3, 216.9, 413.4, 844.1, and 1571.7 photons.μm−2, respectively. Light flash was delivered at time 0. The solid curve is Eq. 1 with σF equal 33.4 photons.μm−2. (B) Flash intensities were 0.09, 0.20, 0.39, 0.72, 1.47, 2.93, 5.99, 11.2, 22.8, 43.4, 90.5, 172.0, 352.9, and 693.7 photons.μm−2, respectively. The solid curve is Eq. 1 with σF equal 1.5 photons.μm−2.
Image published in: Xiong WH and Yau KW (2002)
Copyright © 2002, The Rockefeller University Press. Creative Commons Attribution-NonCommercial-ShareAlike license
Permanent Image Page
Printer Friendly View
XB-IMG-121301