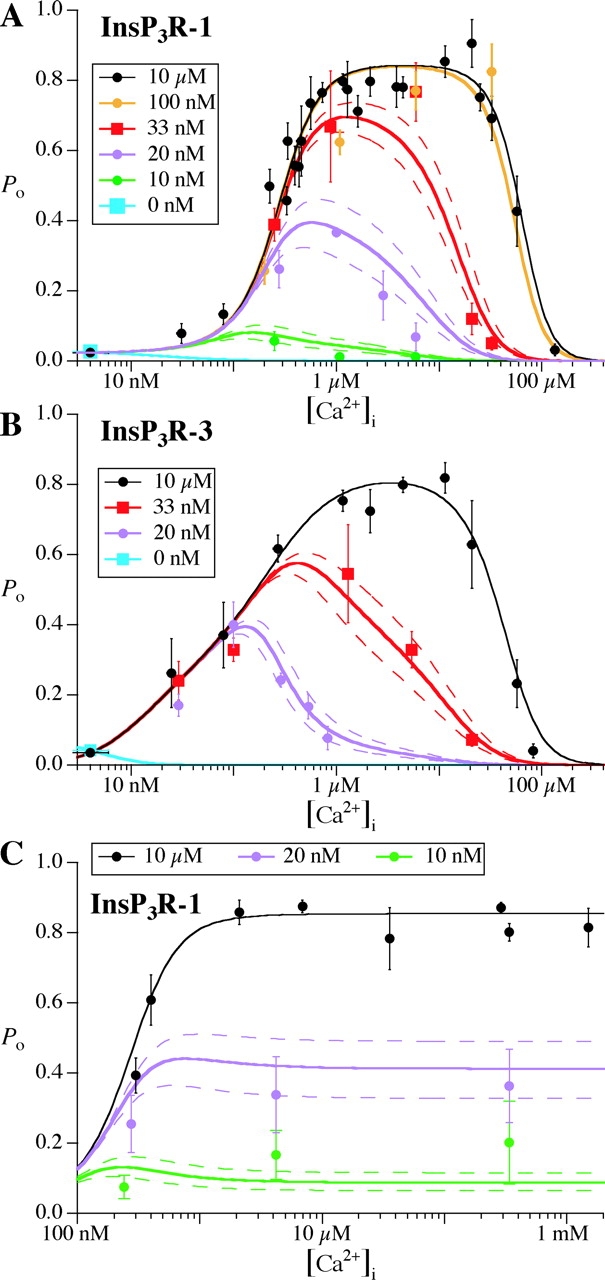
Figure 8. . Fitting of the InsP3R channel Po in various [Ca2+]i and [InsP3] by the MWC-based four-plus-two-conformation model. (A) InsP3R-1 in regular bath (300 nM [Ca2+]), (B) InsP3R-3 in regular bath (300 nM [Ca2+]), and (C) InsP3R-1 in bath containing <5 nM Ca2+. The symbols represent the experimental Po in the tabulated [InsP3]. The continuous curves are the theoretical Po calculated from the model. The dashed curves indicate the range of calculated Po for ± 10% of the tabulated [InsP3]. Parameters used for the Po calculations are tabulated in Table I.
Image published in: Mak DO et al. (2003)
Copyright © 2003, The Rockefeller University Press. Creative Commons Attribution-NonCommercial-ShareAlike license
Permanent Image Page
Printer Friendly View
XB-IMG-121315