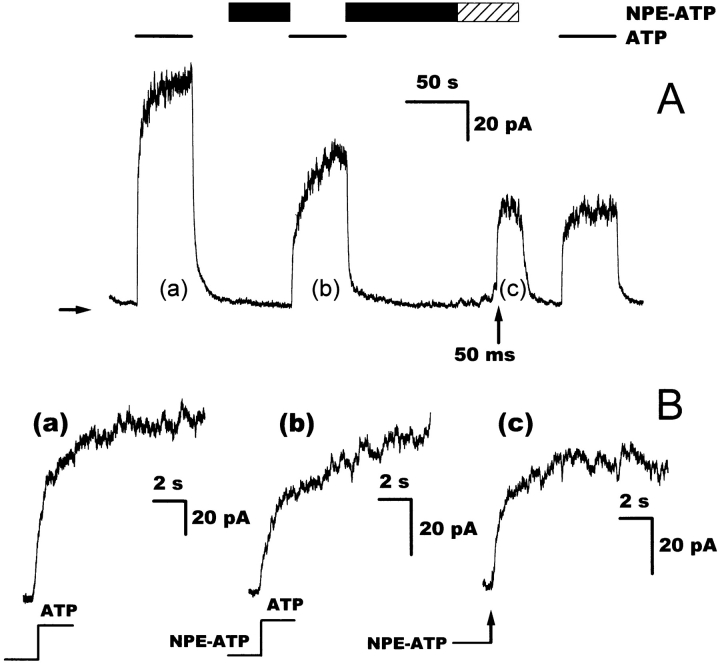
Figure 4. Effects of NPE-ATP on the relaxation current after an ATP jump. (A) The trace shows four consecutive ATP jumps, one of which is an NPE-ATP to ATP jump and one is by photolysis of NPE-ATP. Nucleotide concentrations are 500 μM for both ATP and NPE-ATP. Bars identify additions to the bath solution, the hatched area indicates interruption of the otherwise continuous perfusion. The arrow below the trace identifies the laser pulse used to photolyze the NPE-ATP (325 nm, 25 W cm−2). The horizontal arrow denotes zero current. (B) Comparison of a jump from 0 to 500 μM ATP with two NPE-ATP to ATP jumps, one of which is by rapid solution exchange and one by photolytic cleavage of the NPE-ATP. The ATP jumps are taken from the experiment shown in A at the positions identified by the lowercase letters. The relaxation currents in a and c could be fitted with monoexponential functions with rates of 1.9 s−1 for the solution exchange jump and 2.2 s−1 for the photolysis jump. The relaxation current in b necessitated a fit with two exponentials of approximately equal amplitude, a fast relaxing current with a rate of 2.1 s−1, and a slowly relaxing current with a rate of 0.11 s−1. Experiments were performed ∼800 s after washout of PKA. Similar results were obtained in 12 more solution changes (from nine patches) at 570 ± 150 s after washout of PKA.
Image published in: Weinreich F et al. (1999)
© 1999 The Rockefeller University Press. Creative Commons Attribution-NonCommercial-ShareAlike license
Permanent Image Page
Printer Friendly View
XB-IMG-121492