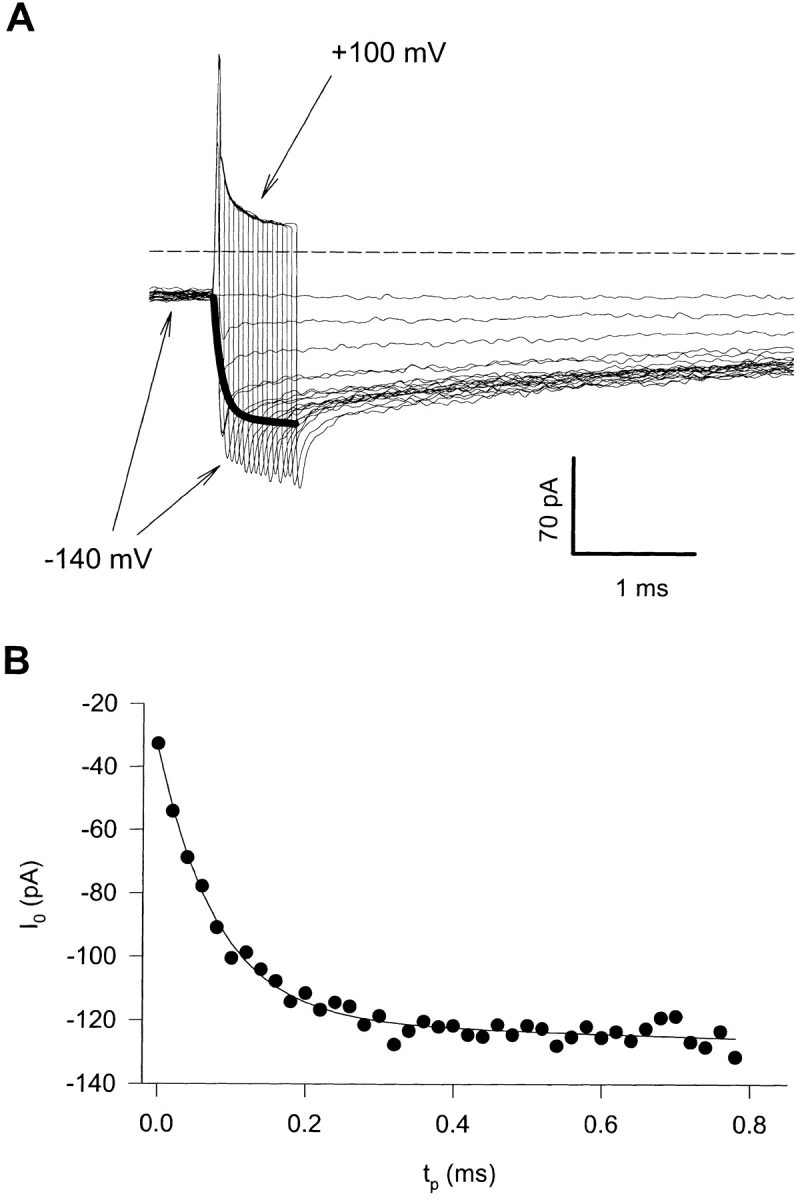
Figure 2. Separation of fast and slow gating process of CLC-1. (A) A 120-ms pulse to −140 mV is followed by a short pulse of varying duration to +100 mV, increasing its duration in 10-μs steps. The patch is then hyperpolarized to −140 mV for 15 ms. The thick line is a double-exponential fit of the initial currents recorded upon hyperpolarization to −140 mV. The initial part of the 120-ms pulse to −140 mV is not shown. Only every second trace is shown on the graph. Dashed line represents zero current. (B) Instantaneous currents recorded upon repolarization at −140 mV plotted as a function of the prepulse duration. The continuous line is a two-exponential fit with time constants of 80 μs and 3.4 ms.
Image published in: Accardi A and Pusch M (2000)
© 2000 The Rockefeller University Press. Creative Commons Attribution-NonCommercial-ShareAlike license
Permanent Image Page
Printer Friendly View
XB-IMG-121910