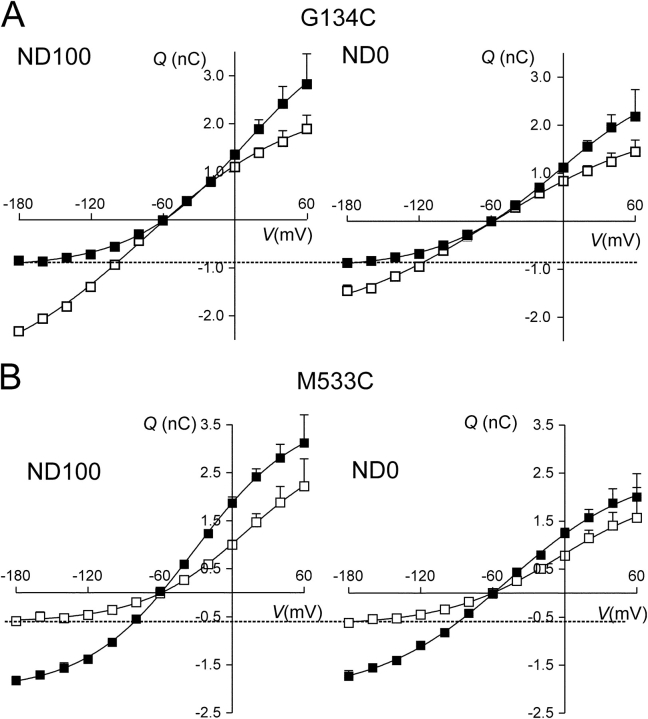
Figure 6. . Analysis of presteady-state relaxations: charge–voltage (Q–V) data for a representative oocyte expressing G134C (A) and M533C (B). Each point is given by (QON–QOFF)/2, where QON and QOFF are the charges moved for the ON and OFF voltage steps from and to −60 mV, respectively. Errors smaller than symbol size are not shown. Left, superfusion in ND100; right, superfusion in ND0 for the same oocyte. Filled symbols, before MTSEA exposure; empty symbols, after MTSEA exposure. Dashed lines have been drawn to indicate the apparent equality of charge movement at hyperpolarizing potentials for ND100 and ND0 superfusion for G134C − MTS and M533C + MTS. Continuous lines were obtained by fitting Eq. 3 to the data. For G134C, the fit parameters were as follows: in ND100 (±MTS), Qmax = 5.1/5.9 nC, Qhyp = −0.9/−3.4 nC; V0.5 = −7/−77 mV; z = 0.5/0.4; and in ND0 (±MTS), Qmax = 4.0/4.3 nC, Qhyp = −1.0/−2.1 nC; V0.5 = −5/−59 mV; z = 0.5/0.4. For M533C, the fit parameters were as follows: in ND100 (±MTS), Qmax = 5.8/3.7 nC, Qhyp = −2.0/−0.7 nC; V0.5 = −32/+11 mV; z = 0.6/0.6; and in ND0 (±MTS), Qmax = 4.8/2.9 nC, Qhyp = −2.1/−0.6 nC; V0.5 = −48/−5 mV; z = 0.5/0.5.
Image published in: Ehnes C et al. (2004)
Copyright © 2004, The Rockefeller University Press. Creative Commons Attribution-NonCommercial-ShareAlike license
Permanent Image Page
Printer Friendly View
XB-IMG-122256