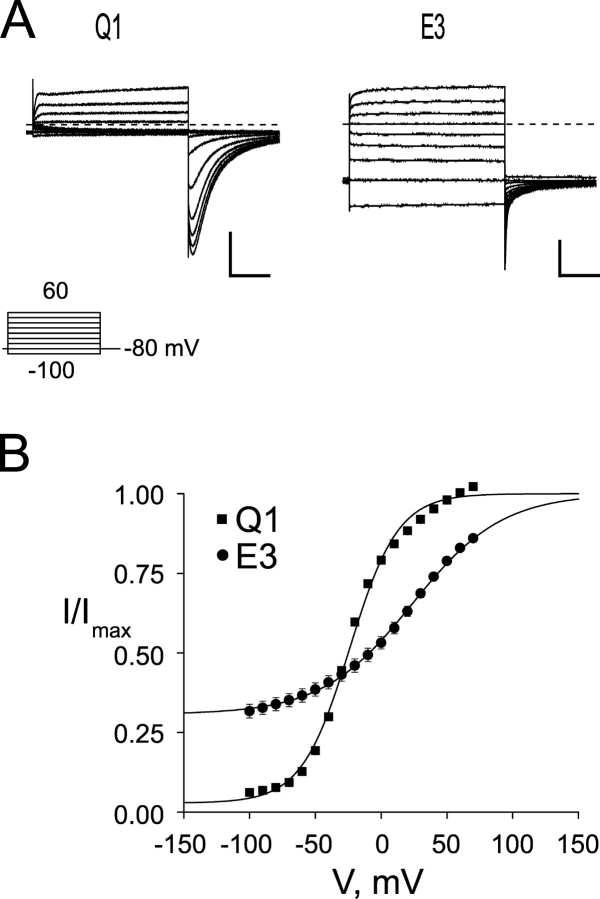
Figure 1. . KCNQ1/KCNE3 channels have a large standing current at negative membrane potentials. (A) Two-electrode voltage clamp recordings from Xenopus oocytes injected with Q1 (left) or Q1/E3 (right). Traces were recorded in KD98 with a 13-s interpulse interval. Dashed line indicates zero current. Inset, “Activation Curve Protocol” of 2-s depolarizations used to elicit currents shown. (B) Voltage–activation curves from Q1 and Q1/E3 channels. Tail currents were measured 3 ms after repolarization, fit to a Boltzmann, and the data normalized such that the upper asymptote was equal to 1. Squares, Q1; circles, Q1/E3. Data were averaged from six oocytes each ± SEM. Scale bars represent 1 μA and 0.5 s.
Image published in: Gage SD and Kobertz WR (2004)
Copyright © 2004, The Rockefeller University Press. Creative Commons Attribution-NonCommercial-ShareAlike license
Permanent Image Page
Printer Friendly View
XB-IMG-122325