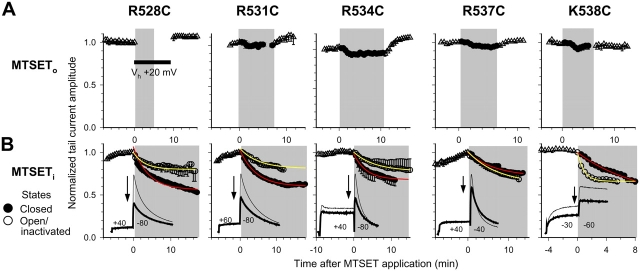
Figure 7. . Sidedness and state dependence of MTSET accessibility to cysteine side chains introduced into positions 528, 531, 534, 537, and 538 (mutant types marked on top). For each channel, the top graph (A) is an average time course of changes in current amplitude before, during (gray shades), and after exposure to extracellular MTSET (1 mM). For R528C, the membrane voltage was held at +20 mV for 10 min and MTSETo was applied during the first 5 min and then washed out for 5 min. For the other mutants, the membrane was pulsing from Vh (−80 mV for all, except K538C, Vh = −90 mV) to Vt (as specified in the insets of lower graphs) for 1 s every 30 s. The solid circles during MTSETo exposure denote closed state–preferred exposure because the channels spent 29 s of the 30-s cycle in the closed states. The bottom graphs (B) show the average time courses of current amplitude before (open triangles) and after intracellular injection of MTSET (estimated initial cytoplasmic concentration 2 mM, gray shades). The closed circles denote closed state–preferred exposure; channels stayed in the closed states at Vh −80 or −90 mV and only activated by 0.5-s test pulses to Vt (as denoted in the insets) once every 30 s. The open circles denote open/inactivated state –preferred exposure; channels stayed in open/inactivated states for 20 s at denoted Vt and only spend 10 s back to Vh once every 30 s. The curves superimposed on the data points are single exponential fits. Insets, original current traces before (thin traces) and 8–16 min after MTSETi injection using the closed state–preferred exposure protocol (thick traces). Arrows indicate the changes in peak tail current amplitudes.
Image published in: Zhang M et al. (2004)
Copyright © 2004, The Rockefeller University Press. Creative Commons Attribution-NonCommercial-ShareAlike license
Permanent Image Page
Printer Friendly View
XB-IMG-122340