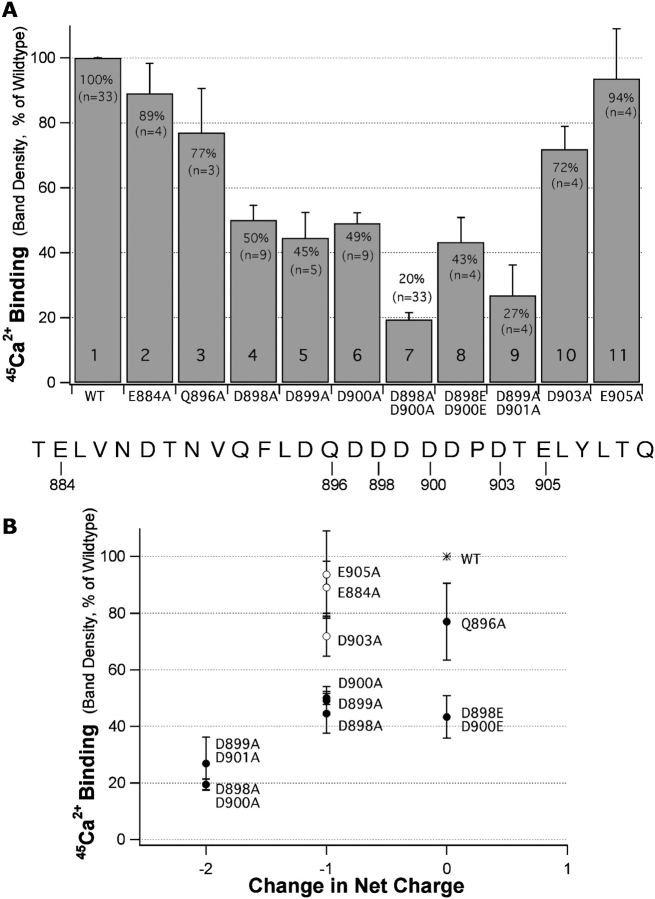
Figure 8. . Ca2+ binding for a series of mutant fusion proteins. (A) 45Ca2+-band densities from overlay assays are plotted as a percentage of wild-type band density for each of ten GST-mSlo207 fusion proteins. (B) 45Ca2+-band density is plotted for each mutant fusion protein as a function of the change in net charge each mutation brings about. Open circles indicate mutations outside the central acidic region of the Ca2+ bowl (896–901). Closed circles indicate mutations inside this central region.
Image published in: Bao L et al. (2004)
Copyright © 2004, The Rockefeller University Press. Creative Commons Attribution-NonCommercial-ShareAlike license
Permanent Image Page
Printer Friendly View
XB-IMG-122462