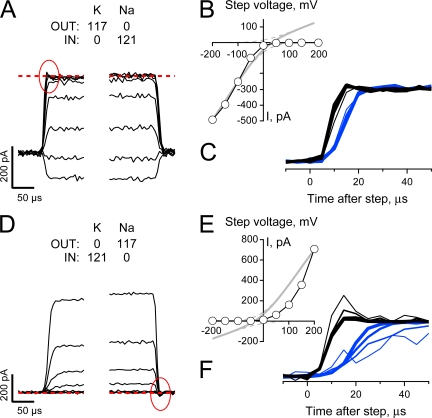
Figure 8. Na sensitivity of Mg block does not account for the collapse of conduction in a K-depleted pore. (A and D) Unblocked HCN2 currents (intracellular solution contained 1 mM EDTA and 1 mM EGTA and no added divalent cations) were collected and processed as described in Fig. 5, A and B, except the cAMP concentration was 30 μM and Na and K were presented biionically (with the direction of the gradients reversed in the two records as indicated). Red circles indicate a small transient present in the current collapse time course that is absent in the recovery time course. Data are representative of four and three similar recordings for A–C and D–F, respectively, with records in A–C from the same patch shown in Fig. 5, A and B. (B and E) Plateau tail current amplitudes (measured 1 ms after the beginning of each test step) plotted versus the corresponding step potential. (C and F) Expanded views of the collapse (black lines) and recovery (blue lines) of current observed when the potential was stepped between −140 mV and test potentials of +50 to +200 mV (thicker lines represent steps to more depolarized voltages). In each panel the currents have been normalized to change from 0 to 1 for both the step to, and the return from, the depolarized test potentials and each phase of the sweep shifted on the time axis so its beginning is aligned with respect to its onset.
Image published in: Lyashchenko AK and Tibbs GR (2008)
Copyright © 2008, The Rockefeller University Press. Creative Commons Attribution-NonCommercial-ShareAlike license
Permanent Image Page
Printer Friendly View
XB-IMG-122569