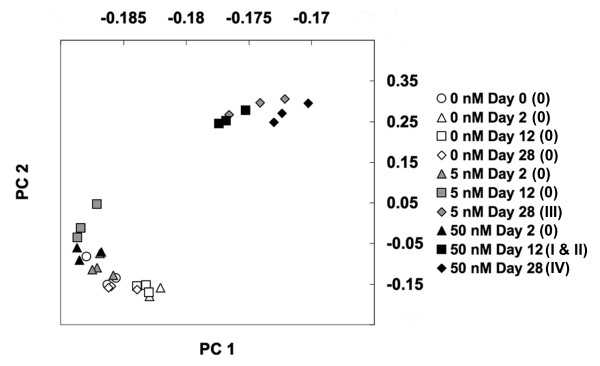
Figure 2. Results of the principal component analysis. Scatter plots of the 30 GeneChips based on the rotations of their first two principal components (PC 1 and PC 2). PCA was performed on all 3688 probe-sets that were available for significance testing. PC 1 and PC 2 account for 89.2% and 6.2% of the variance respectively. Cano-Martinez stages are listed in parenthesis in the legend.
Image published in: Page RB et al. (2008)
Copyright © 2008 Page et al; licensee BioMed Central Ltd. Creative Commons Attribution license
Permanent Image Page
Printer Friendly View
XB-IMG-122579