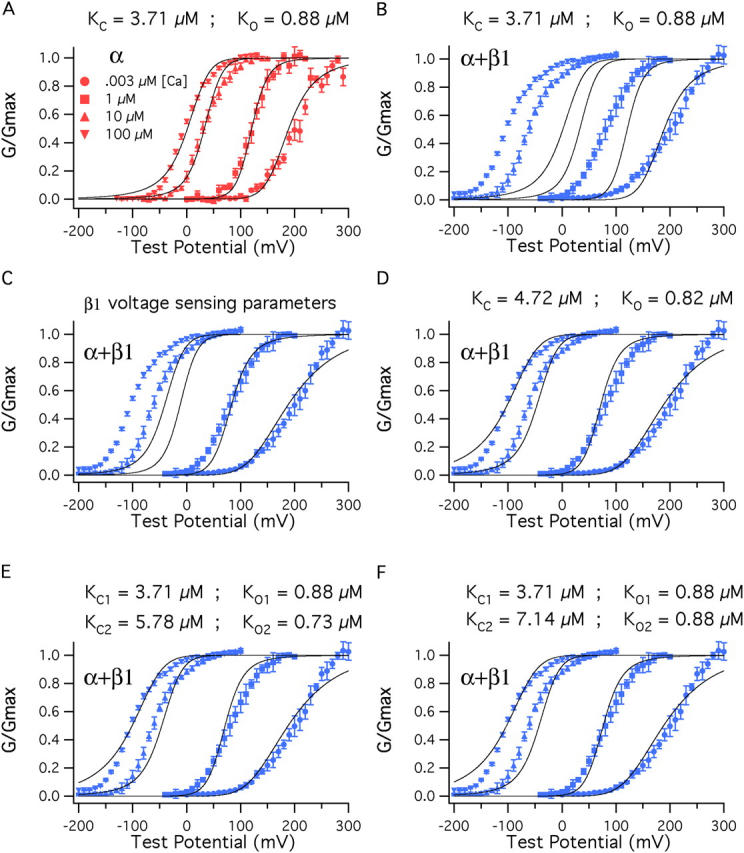
Figure 9. β1 also affects Ca2+ binding. (A) BKα G–V relations at a series of Ca2+ concentrations fitted simultaneously (solid curves) with Eq. 14. Only KC and KO were allowed to vary. The fit yielded KC = 3.71 μM and KO = 0.88 μM. The other parameters of the fit were determined from experiments performed with nominally 0 Ca2+ (3 nM) (Vhc = 151 mV, L = 2.2 × 10⁻⁶, Vho = 27 mV, zJ = 0.58, zL = 0.41). (B) The fit from A is superimposed on a series of BKα+β1 G–V curves. (C) The voltage-sensing parameters of the model were altered to reflect the changes that occur as β1 binds, Vho = (27→−34 mV), Vhc = (151→80 mV), L = (2.2 × 10⁻⁶→2.5 × 10⁻⁶). (D) With BKα+β1 voltage-sensing parameters KC and KO were allowed to vary freely, yielding the fit shown and KC = 4.72 μM, KO = 0.82 μM. (E) Here, the BKα+β1 voltage-sensing parameters were used for the fit, and β1 was allowed to influence only half of the channels' eight Ca2+-binding sites. The data are fit with Eq. 13. KC1 and KO1 were held at 3.71 μM and 0.88 μM, respectively. KC2 and KO2 were allowed to vary freely, yielding KC2 = 5.78 μM, KO2 = 0.73 μM. (F) The data are again fit with Eq. 13 but now KO2 was held at 0.88 μM and only KC2 was allowed to vary. This yielded KC2 = 7.14 μM.
Image published in: Bao L and Cox DH (2005)
Copyright © 2005, The Rockefeller University Press. Creative Commons Attribution-NonCommercial-ShareAlike license
Permanent Image Page
Printer Friendly View
XB-IMG-122754