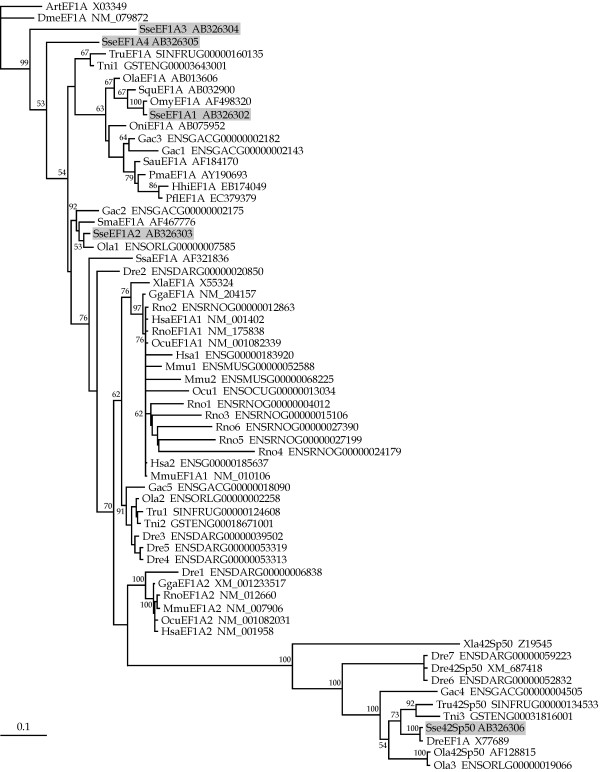
Figure 2. Phylogenetic relationships among SseEF1As and a wide range of vertebrate eEF1As (see Table 3) using the maximum likelihood method. D. melanogaster and Artemia sp elongation factor 1 alpha proteins were used as outgroups to root tree. Only bootstrap values higher than 50% are indicated on each branch. The scale for branch length (0.1 substitutions/site) is shown below the tree.
Image published in: Infante C et al. (2008)
Copyright © 2008 Infante et al; licensee BioMed Central Ltd. Creative Commons Attribution license
Permanent Image Page
Printer Friendly View
XB-IMG-122771