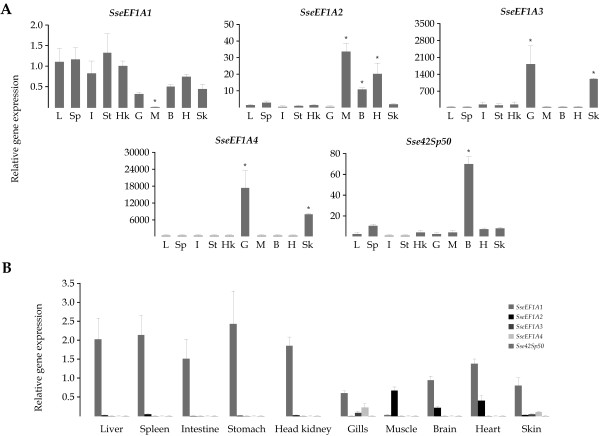
Figure 4. A) Relative expression levels in tissues of the five SseEF1A genes. Expression values were normalized to those of Ubiquitin. Data were expressed as the mean fold change (mean ± SEM, n = 3) from the calibrator group (liver). Values marked with an asterisk are significantly different from liver values (P < 0.05). L: liver, Sp: spleen, I: intestine, St: stomach, Hk: head-kidney, G: gills, M: skeletal muscle, B: brain, H: heart, Sk: skin. B) Comparison of the relative levels of SseEF1A transcripts in tissues. Data are expressed as the ratio (calculated using 2-(ΔCt)) of target mRNA to Ubiquitin mRNA.
Image published in: Infante C et al. (2008)
Copyright © 2008 Infante et al; licensee BioMed Central Ltd. Creative Commons Attribution license
Permanent Image Page
Printer Friendly View
XB-IMG-122773