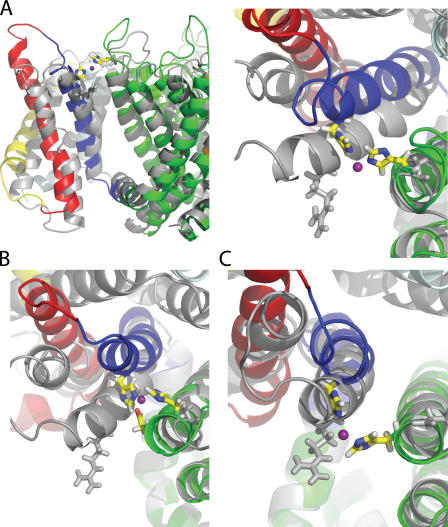
Figure 7. Comparison of the Kv1.2 crystal structure (Long et al., 2005) with instantaneous configurations taken from the MD simulations of the wild-type channel and mutant channels. (A) R294H-A351H-D352G-E353S (side and top view). (B) R294H-A351H (top view). (C) R294H-D352H (top view). Crystal structure is shown in gray. Mutant channel is represented as following: S1-cyan, S2-yellow, S3-red, S4-blue, pore-green, and Zn2+-violet. All the mutant structures were taken from the last snapshot of the MD trajectories. (See online supplemental material for the coordinates of the open activated Kv1.2 model obtained from R294H-A351H-D352G-E353S simulation in the presence of metal bridge).
Image published in: Lewis A et al. (2008)
© 2008 Lewis et al. Creative Commons Attribution-NonCommercial-ShareAlike license
Permanent Image Page
Printer Friendly View
XB-IMG-122946