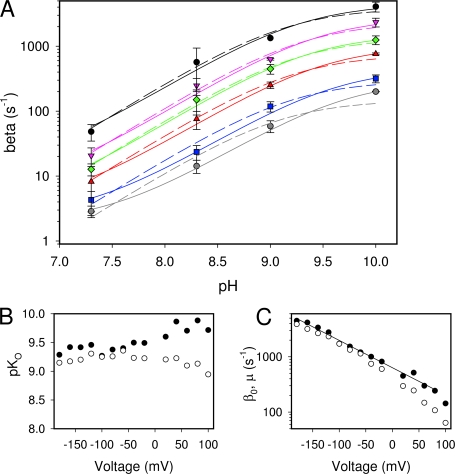
Figure 8. pH dependence of the closing rate constants—first models. (A) Plots of the values for the closing rate constant (same values as in Fig. 6) as a function of pH with different symbols for different voltages (for clarity, values are shown only for a few representative voltages: black circles, −180 mV; pink triangles down, −120 mV; green diamonds, −80 mV; red triangles up, −40 mV; blue squares, 20 mV; gray circles, 60 mV). Solid lines are fits of Eq. 5 with the resulting pKO and β0 reported in B and C, respectively, as filled circles. The solid line in C is a fit of the filled circles to an exponential function of the form β0 = β0(0)*exp(z*VF/(RT)), where F is Faradays constant, R the gas constant, T the absolute temperature, β0(0) the value of β0 at 0 mV, and z the “slope” of the curve, resulting in z = 0.28. Dashed lines in A are fits of Eq. 7 with the resulting pKO and μ reported in B and C, respectively, as open circles.
Image published in: Zifarelli G et al. (2008)
© 2008 Zifarelli et al. Creative Commons Attribution-NonCommercial-ShareAlike license
Permanent Image Page
Printer Friendly View
XB-IMG-123041